The cache was working perfectly. That was the problem.
 The cache was working perfectly. That was the problem.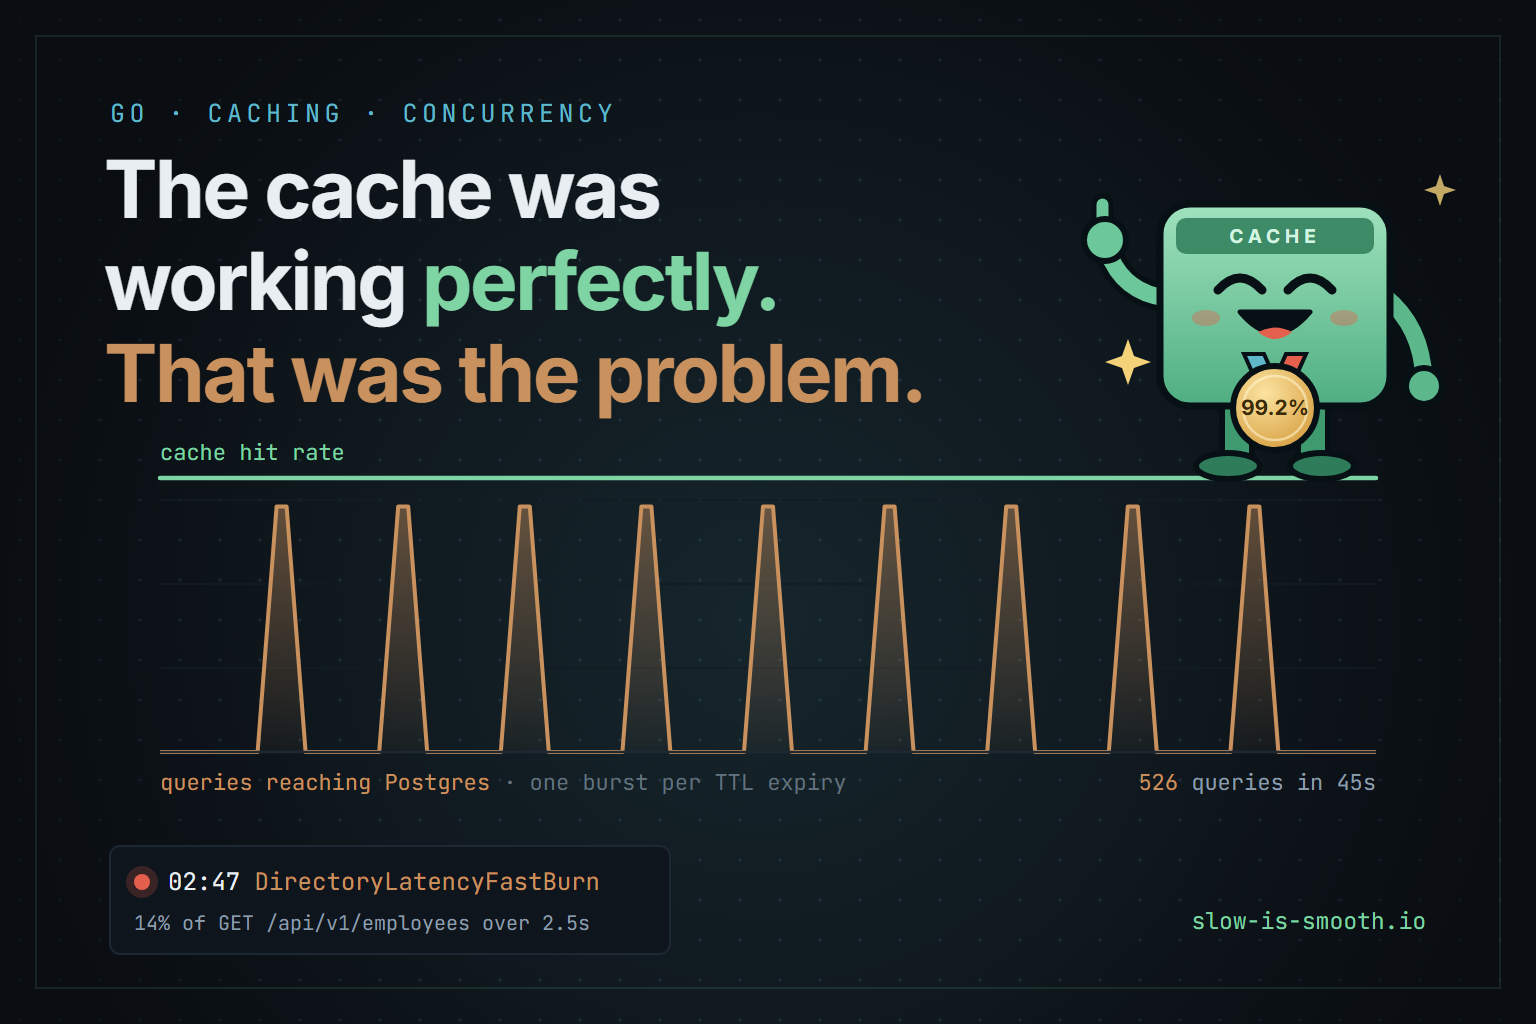
Contents
02:47
Falafel Corp runs a one-person on-call rotation, which is a staffing decision that looks efficient right up until the night it isn’t. Tonight it is your turn, and the phone goes off on the nightstand, and you are awake before you are conscious.
The page is DirectoryLatencyFastBurn. Fourteen percent of requests to
GET /api/v1/employees are slower than 2.5 seconds, sustained across both the one-hour and
five-minute windows. That’s the burn-rate alert doing its job — it fires when you’re
consuming the error budget fast enough that waiting until morning means there’s no budget
left by morning.
You open the dashboard expecting a bad deploy. There wasn’t one. Last release was Tuesday.
You check Postgres. It’s alive, it’s answering, pg_stat_activity shows a wall of identical
SELECT ... FROM employees statements, most of them in active, a few in
ClientRead. CPU is high but not pegged. Nothing is deadlocked. Nothing is erroring.
You check the API. No panics, no 5xx spike worth the name, just latency. Requests are queueing somewhere and coming out the other side eventually.
And then you check the cache, because obviously the cache is broken, and the cache says:
cache_requests_total{backend="redis",result="hit"}       114941
cache_requests_total{backend="in_process",result="hit"}    6680
cache_requests_total{backend="none",result="miss"}          884
A 99.2% hit rate. Over the window that matters, the cache is doing beautifully.
This is the part of the night where you start doubting the instruments.
About this piece. The story is invented. Falafel Corp is not a real company, nobody was paged at 02:47, and the on-call engineer is a device — a way to walk through a failure mode from the inside, at the speed you’d actually meet it, rather than describing it from above.
The engineering is not invented. The code is from a Go service I built, the configuration defaults are that service’s real defaults, and every number under “What it actually did” was measured against a 500,000-row Postgres database. Names have been changed throughout — the service, its package, its endpoints, its metrics — because the original isn’t mine to name. Nothing else was: no logic, no configuration value, no measurement. The Go below is the real implementation, not a sketch of it, and the numbers are the ones the runs produced.
The service is
directory-apihere. It serves an organizational hierarchy — 500,000 employees, computed org-depth and sub-org-size per row, filterable and sortable, behind a two-tier Redis + in-process result cache.
The misdirection
The hit rate is true. It’s also useless, and it’s useless for a reason worth internalizing: a stampede is invisible at any averaging window wider than the TTL.
Here is the shape of the thing. One popular query — the first page of the employee directory, sorted by name, the one every client requests on load — is cached with a 30-second TTL. For 29.97 seconds, every request is a hit. Then the entry expires, and in the milliseconds before one request finishes recomputing it and writing it back, every other request that arrives finds an empty cache and goes to the database. All of them. Each one convinced it’s the one that has to do the work.
Then the value lands, and everybody’s a cache hit again for another 30 seconds.
Average that over five minutes and you get 99.2%. The 0.8% isn’t noise — it’s nine cliffs, and the system falls off every one of them.
The tell
The metric that gives it away isn’t a cache metric at all. It’s the database one:
db_query_duration_seconds_count{query="list_employees"}
That counter increments once per list query that actually reached Postgres. Graph it as a rate and the sawtooth is unmistakable: flat, spike, flat, spike — one spike per TTL period, metronomically. Not correlated with anything upstream. Not correlated with a deploy. Just the clock.
The metric that tells you, and the one that doesn't
One 45-second run. Every list query that actually reached Postgres, placed at the TTL expiry that caused it.
Totals are measured — pair 1 of the comparison below. Their placement inside the run is schematic: per-instant query rate wasn't recorded, so each burst is drawn at the expiry that caused it. Switch the toggle and watch the left-hand number barely move.
Both of those numbers describe the same run. The one on the left is the one you page on.
And once you see it, the arithmetic gets uncomfortable. This service runs with:
| Setting | Default | What it means at 02:47 |
|---|---|---|
DB_MAX_CONNECTIONS | 25 | Twenty-five queries can run. Concurrent request #26 waits. |
MAX_CONCURRENT_REQUESTS | 256 | The API will happily accept 256 in-flight requests first. |
REQUEST_TIMEOUT_SECONDS | 15 | A request that waits longer than this gets a 504. |
DB_STATEMENT_TIMEOUT_SECONDS | 30 | Deliberately above the request timeout. |
So a hundred simultaneous cache misses do not become a hundred parallel queries. They become a hundred-deep queue in front of twenty-five connections. The pool doesn’t protect you from a stampede; it converts a stampede into a queue, and a deep enough queue is a timeout, and enough timeouts is an outage. That’s the mechanism by which “the cache expired” becomes “the API is down.”
The pool doesn't absorb a stampede. It queues one.
What happens at a single TTL expiry with 100 requests in flight.
The really unpleasant property: the size of the stampede scales with your traffic. The number of duplicate queries per expiry is roughly
arrival rate × how long the uncached query takes
which means the busier you are, the worse each expiry hurts, which means this is a failure that stays politely hidden right up until you’re successful enough for it to matter.
Three fixes that don’t work
Raise the connection pool. Now 100 queries run at once instead of 25. You have moved the queue from the pool into Postgres, where it competes for shared buffers and CPU with everything else, and where you can’t see it as easily. The duplicate work is still duplicate.
Raise the TTL. Fewer stampedes, each one bigger, and staler data between them. You’ve reduced the frequency of the cliff by making the cliff taller.
Jitter the TTL. Genuinely good advice — for a different problem. Jitter stops a thousand different keys from expiring in the same instant because they were all populated in the same instant (a cold start, a deploy, a cache flush). It does exactly nothing for one hot key, because there’s only one expiry time to jitter and every caller is waiting on that same one. And the one hot key is the one that hurts, precisely because it’s hot.
All three treat the symptom. The actual defect is simpler to state: when N requests want the same uncached value, the system does N units of work to produce one answer.
The fix
Do one unit of work. Give everyone the answer.
That’s singleflight — a small piece of golang.org/x/sync whose entire job is to collapse
concurrent calls sharing a key into a single execution, then hand the result to every caller.
Here is the whole read-through path. This is the real function, with its doc comments removed for length — everything they say is said in prose below:
func cachedFetch[V any](
	ctx context.Context,
	name string,
	store resultStore[V],
	flight *singleflight.Group,
	key string,
	fetch func(context.Context) (V, error),
) (V, error) {
	var zero V

	if v, ok := store.Get(ctx, key); ok {
		return v, nil
	}

	ch := flight.DoChan(key, func() (any, error) {
		detached := context.WithoutCancel(ctx)

		if v, ok := store.Get(detached, key); ok {
			return v, nil
		}

		v, err := fetch(detached)
		if err != nil {
			return zero, err
		}
		store.Set(detached, key, v)
		return v, nil
	})

	select {
	case res := <-ch:
		if res.Shared {
			observability.CacheSingleflightSharedTotal.WithLabelValues(name).Inc()
		}
		if res.Err != nil {
			return zero, res.Err
		}
		return res.Val.(V), nil
	case <-ctx.Done():
		return zero, ctx.Err()
	}
}
Forty lines. The idea is a one-liner. Getting it right is not, and the three things that make it not-a-one-liner are the reason this is worth writing down.
It is generic over the value type because there are two caches behind one list response, not one. A page depends on the filters, the sort and the position; the total count depends on the filters alone, so it survives a page walk that changes the page key on every iteration. Each gets its own store and its own flight group:
func (r *CachingRepository) List(ctx context.Context, q Query, scope Scope) (ListResult, error) {
	total, err := cachedFetch(ctx, cacheNameCount, r.counts, &r.countFlight, countCacheKey(q, scope),
		func(fetchCtx context.Context) (int64, error) {
			return r.inner.Count(fetchCtx, q, scope)
		})
	if err != nil {
		return ListResult{}, err
	}

	page, err := cachedFetch(ctx, cacheNameList, r.pages, &r.pageFlight, cacheKey(q, scope),
		func(fetchCtx context.Context) (ListResult, error) {
			return r.inner.ListPage(fetchCtx, q, scope)
		})
	if err != nil {
		return ListResult{}, err
	}

	page.TotalCount = total
	return page, nil
}
The three things that will bite you
1. The leader-disconnect trap
singleflight runs the shared function under whichever caller happened to arrive first. If
you write the obvious version:
v, err := fetch(ctx) // ctx belongs to whichever caller arrived first
then you have built a machine where one client hanging up fails everybody else. The
first caller’s context is cancelled when their connection drops — browser closed, tab
navigated away, load balancer timed out, client hit Ctrl-C. That cancellation propagates
into the shared query. The query dies. And every other request waiting on that flight — none
of whom disconnected, all of whom are still there — gets context.Canceled handed back to
them for something they had no part in.
You’ve converted “one user gave up” into “everyone waiting gets a 500.” Under exactly the conditions where a lot of people are waiting.
Whose context the shared query runs under
Four callers, one flight, and the first one hangs up. The only thing that differs between these two is the context passed to the inner call.
statement_timeout, so a runaway
query dies whether or not anyone is still listening.The fix is context.WithoutCancel(ctx): keep the values (trace span, request ID, so the
query is still attributable in logs and traces) and drop the cancellation. The obvious
objection is that you’ve now removed the thing that bounds the query — and you have, on the
client side. Which is fine here, because the bound that matters is server-side: every pooled
connection is opened with a statement_timeout, so a runaway query is killed by Postgres
whether or not anyone is still listening. The deadline you removed was never the real safety
net.
This is the kind of bug that never appears in a sequential test, because sequentially there
is only ever one caller and they never disconnect. It needs a test that parks a query
mid-flight, piles waiters behind it, cancels the leader, and asserts the waiters still
succeed — TestCachingRepository_LeaderCancellation_DoesNotFailWaiters, in this case. It
also asserts the inner call never observed a cancellation at all, because “the waiters happened to survive” and “the shared query was
properly detached” are different claims.
2. The flight key is a security boundary
This API is scoped: a CTO sees their own subtree, not the whole company. That’s enforced as a SQL predicate, and it’s folded into the cache key, because a cache key that ignores the caller’s scope is a machine for serving one person’s rows to another.
The flight key needs the same discipline, and it’s much easier to get wrong, because a flight feels like an implementation detail — a deduplication hint — rather than a thing that decides who sees what. It isn’t. If you key the flight on anything narrower than the cache key, then two callers with different scopes who arrive at the same moment get collapsed onto one query, and one of them receives the other’s rows.
Note what makes this so nasty: it is only reachable under concurrency. Sequentially, the cache key is correct and everyone gets the right data. The leak requires two differently scoped callers to miss simultaneously. That’s not a scenario a normal test suite explores, and it’s not a scenario that shows up in code review unless someone is specifically asking “what is this key, and is it the same key as the one guarding the data?”
Here the flight is keyed on cacheKey(q, scope) — literally the same string the store uses,
RestrictToPath and all — so the two can’t drift apart. And
TestCachingRepository_ConcurrentMissesDifferentScope_DoNotCollapse pins it: two scopes, two
concurrent misses, assert two queries, not one. It’s a test that asserts the optimization
doesn’t happen, which is a strange thing to write and exactly the right thing to write.
3. The race back to the store
There’s a window between “the leader stored its result” and “the leader’s flight was retired.” A caller that checked the store just before the write, and arrives just after the flight is gone, starts a brand new flight — and that flight is about to query the database for a value now sitting in the cache.
Hence the second lookup, inside the flight function:
ch := flight.DoChan(key, func() (any, error) {
	detached := context.WithoutCancel(ctx)

	if v, ok := store.Get(detached, key); ok {
		return v, nil        // someone already did this work
	}
	...
Note it reads the store under detached, not ctx — the same trap as #1, one level down. A
cancelled context makes the Redis lookup fail, a failed lookup is indistinguishable from a
miss, and a miss here sends exactly the query this check exists to prevent. The tier that’s
supposed to save you is the one that quietly stops working.
This looks like paranoia. It measurably is not — see below.
What it actually did
Here the story stops and the measurements start.
Setup: 500,000 employees in Postgres, 100 concurrent virtual users hammering one unvarying
URL with no think time, CACHE_TTL_SECONDS=5 so a 45-second run crosses about nine expiries.
The URL is a single fixed query —
/api/v1/employees?page=1&page_size=20&sort=user_full_name:asc — issued as
X-User-Role: CEO, the widest RBAC scope, so no narrowing predicate shrinks the query. The
expensive part is the unbounded COUNT over 500k rows, not the twenty-row page. Rate limiting
is off, because a single load-generating host isn’t caller-diverse and the limiter would
otherwise reject traffic for reasons unrelated to what’s being measured.
The machine was an i9-13980HX laptop under Windows 11, with Postgres and Redis in Docker
Desktop, both API builds running natively and k6 in a container pointed at the host. The seed
was go run ./cmd/seed -mode=synthetic -count=500000 — a 1m40.9s bulk load.
The headline number is server-side, so the k6 scenario takes it itself rather than leaving me to assemble it afterwards. This is the whole of that mechanism — the seed-size guard and the error branches removed, nothing else changed:
const LIST_QUERIES = 'db_query_duration_seconds_count{query="list_employees"}';
const CACHE_MISSES = 'cache_requests_total{backend="none",result="miss"}';
// Absent on a pre-singleflight build, which is the point — scrapeCounter
// returns 0 rather than failing, so one script covers both builds.
const SHARED = 'cache_singleflight_shared_total';

// Pull one counter out of the Prometheus text exposition. Matching the full
// metric line including labels keeps list_employees distinct from the
// count_employees series sitting next to it.
function scrapeCounter(name) {
  const res = http.get(`${BASE_URL}/metrics`);
  const line = res.body.split('\n').find((l) => l.startsWith(name));
  return line ? Number(line.slice(line.lastIndexOf(' ') + 1)) : 0;
}

export function setup() {
  return {
    listQueries: scrapeCounter(LIST_QUERIES),
    cacheMisses: scrapeCounter(CACHE_MISSES),
    shared: scrapeCounter(SHARED),
  };
}

export function teardown(data) {
  const listQueries = scrapeCounter(LIST_QUERIES) - data.listQueries;
  const cacheMisses = scrapeCounter(CACHE_MISSES) - data.cacheMisses;
  const shared = scrapeCounter(SHARED) - data.shared;

  console.log(`STAMPEDE_RESULT list_queries_to_postgres=${listQueries}`);
  console.log(`STAMPEDE_RESULT cache_misses=${cacheMisses}`);
  console.log(`STAMPEDE_RESULT singleflight_shared=${shared}`);
}
Those three counters are every quantity this piece quotes. “Queries reaching Postgres” is not
an inference from latency or from cache hit rate — it is one counter, read before the run and
after it, subtracted. Every value in the first column of the table below is that subtraction,
and the misses − shared arithmetic further down comes from the other two.
The comparison is between two builds of the same commit, and that is not the obvious choice.
The obvious one is to measure the commit that introduced singleflight against its parent — and
it is confounded, because that commit bundles the singleflight change with connection-pool
bounding, request bounding, config additions and the defensive cloneResult copies, across
nineteen files. Any difference could belong to any of them.
So the “before” build is that same commit with only the DoChan block removed: replaced by a
direct call to the inner repository followed by a store.Set, with the flight field and the
golang.org/x/sync/singleflight import dropped. diff -rq confirmed cache.go was the only
differing Go file. The “after” build is the commit untouched.
The two were alternated pair by pair so machine drift hit both equally. This matters more than it sounds: the same binary varied ~3× in throughput across the session. A “before” and an “after” measured an hour apart would have told me whatever I wanted to hear. (The no-singleflight build also ran first in every pair, and drift ran toward worse over time, so the ordering penalizes singleflight rather than flattering it.)
Two earlier sets of runs were thrown away: one against a slightly older tree, before the
cloneResult copies and the detached double-check landed, and one that made exactly the
confounded parent-versus-child comparison described above. Both are excluded from everything
below. Both agreed with it on the query-count result.
| Pair | Build | List queries → Postgres | Misses | Shared | Requests served | Throughput | p95 |
|---|---|---|---|---|---|---|---|
| 1 | no singleflight | 526 | 526 | 0 | 59,678 | 1,297/s | 110.96ms |
| 1 | singleflight | 10 | 236 | 226 | 55,616 | 1,207/s | 113.96ms |
| 2 | no singleflight | 438 | 438 | 0 | 57,173 | 1,242/s | 100.81ms |
| 2 | singleflight | 9 | 244 | 235 | 59,089 | 1,283/s | 98.00ms |
| 3 | no singleflight | 111 | 111 | 0 | 28,748 | 617/s | 238.76ms |
| 3 | singleflight | 9 | 211 | 202 | 51,527 | 1,113/s | 153.03ms |
| archived | no singleflight | 72 | 72 | 0 | 17,166 | 366/s | 676.17ms |
| archived | singleflight | 9 | 160 | 151 | 43,629 | 948/s | 240.14ms |
Zero failed requests in any run, ~372k requests total.
The no-singleflight rows are worth a second look before anything else: misses equal queries exactly, and nothing is ever shared. That is the instrument confirming itself — with no collapsing, one cache miss is one query, every time, which is precisely the behaviour the whole piece is about.
The ratio is nice — 8× to 53× fewer queries. But the ratio is not the finding. The finding is that the two columns are different kinds of number.
Without singleflight, the query count tracks load: pair 1 served the most requests and
produced the most duplicate queries (526); pair 3 served roughly half as many and produced
111. Busier system, bigger stampede, exactly as arrival rate × query duration predicts.
With singleflight, the count is 9 or 10, every single time, against the ~9 TTL expiries a 45-second run contains. It doesn’t move when traffic doubles. It’s pinned to the clock instead of to load.
That’s the property worth having. Not “fewer queries” — a query count that has stopped being a function of how popular you are.
The part I didn’t expect
Look at the throughput column. Pairs 1 and 2 are a dead heat — p95 within 4%, throughput within 7%. Postgres ate 400–500 duplicate queries per run and didn’t blink.
Pairs 3 and the archived pair, run later when the laptop was more contended, are not a dead heat at all: 617→1,113 req/s and 366→948 req/s, with p95 improving from 238ms to 153ms and from 676ms to 240ms. Same code. Same load generator. Same URL. The only difference is whether the database still had capacity to waste on duplicate work.
The p95 is the number I quoted, but it isn’t the whole shape. Every quantile moved, and the further into the tail you look, the more it moved:
Where the time actually went
Request latency by quantile, archived pair — same URL, same load generator, 100 VUs for 45 s. Lower is better.
Also from these two runs: fastest request 8.21 ms → 3.76 ms, mean 271.91 ms → 104.93 ms, throughput 366/s → 948/s, requests served 17,166 → 43,629. Zero failed requests in either.
The median improves by 64ms and the maximum by 663ms. That asymmetry is the stampede: at the median you are usually being served from cache in both builds, and the duplicate queries only decide what happens to the requests unlucky enough to arrive during an expiry.
Which is the honest shape of this optimization, and it’s worth stating plainly because it’s easy to oversell in both directions: with headroom, deduplicating queries is invisible; without headroom, it’s worth about 2× throughput. You are not buying speed. You are buying the distance between “fine” and “falling over,” and that distance only shows up as speed on the day you’ve already spent it.
Caveats, because n=4 pairs on one laptop is not a benchmark suite: the contention was incidental rather than controlled, and the effect appears in exactly the two pairs where the no-singleflight run was itself degraded. That supports “this matters under database pressure.” It does not support any particular speedup number, and I’d distrust anyone who quoted one from data this thin.
The double-check earns its keep
Remember the paranoid second lookup. In every singleflight run, misses − shared came out
exactly equal to the query count: 236−226=10, 244−235=9, 211−202=9, 160−151=9. That
decomposes, per expiry, into:
- one flight with ~20 callers piled onto it — one query, and
Sharedset for all of them; - one single-caller flight forming immediately afterward — arriving in that narrow window — which issues no query at all, because the double-check found the freshly-stored value.
Delete those four lines and each of those ~9 solo flights per run issues a redundant query. The singleflight column roughly doubles, 9 → ~18. It isn’t a theoretical race that fires once a month; under this load it fires about once per TTL cycle, reliably enough to show up in counter arithmetic in every single run.
What this does not fix, and what I can’t claim
It did not prevent an outage, because nothing was close to one. Zero requests failed in any run — no timeouts, no tripped circuit breakers, no pool exhaustion, in either build, in any pair. The 02:47 page at the top of this piece did not happen and this data does not show it happening. What I measured is the mechanism that leads there, plus the two pairs where the mechanism started visibly costing throughput. Extrapolating from “2× throughput on a contended laptop” to “prevents outages” is a story, not a measurement, and I’ve already used up my fiction budget at the top of the page.
It doesn’t help unless the duplicated work is expensive. Collapsing N queries into one is worthless if the query was cheap and the database was bored — which is precisely what pairs 1 and 2 show. The fix is only as valuable as the work it’s deduplicating.
It’s per-process. Run four replicas and a TTL expiry produces up to four queries, not one. Redis as a shared first tier narrows the window — whichever replica wins writes the value where the others can see it — but that’s a race, not a lock. Cross-process collapse means a distributed lock, which means a whole new dependency in the request path that can itself fail, and for four replicas saving three queries per TTL, that trade is not obviously worth it. It might be at forty.
It only helps repeated keys. Cursor-paginated traffic advances to a new key every iteration, so it never collides with itself and never benefits. The scenarios in the main load test that vary their query on every call are unaffected by design.
Failures aren’t cached. If the shared query errors, every waiter gets the error and the next request tries again. That’s deliberate — caching a failure turns a blip into a TTL-length outage — and it’s safe here because the circuit breaker in front of Postgres saw one failed query rather than one per waiter, which is the thing that stops retry from being unbounded.
The takeaway
A cache doesn’t remove work. It removes repetition of work, and it does that by introducing a moment — the expiry — when the repetition all comes back at once. You have converted a steady latency problem into an intermittent concurrency problem, and concurrency problems have the charming property of being invisible in every metric you average.
Which suggests the actual lesson, the one that generalizes past caches: when you add a layer that makes the common case cheap, go and look at what the uncommon case now costs. It is almost never what it cost before you added the layer. Usually it’s worse, because the whole system has quietly reorganized itself around the assumption that the layer is working.
Our invented on-call engineer goes back to bed around four, having changed nothing. The fix ships on Thursday. Until then the dashboard will go on insisting, correctly and uselessly, that the cache is working perfectly.
That was the problem.
A note on the evidence
Everything this piece rests on is in it. The implementation is the real cachedFetch, not a
sketch of it. The measurement is defined by the counter arithmetic above rather than asserted.
The methodology — which builds, why not the obvious comparison, what was discarded — is in the
prose rather than in a file you’d have to take on trust.
What isn’t here: the service itself, so none of this is runnable by you; the concurrency tests, though the two that matter are named where they’re discussed; and the k6 thresholds, which were informational rather than pass/fail — the pre-singleflight build was expected to breach them, and did.
Identifiers are renamed as described in the note below the opening scene. No logic, configuration value or measurement was changed.