Finding Errors in Log Streams
 Finding Errors in Log Streams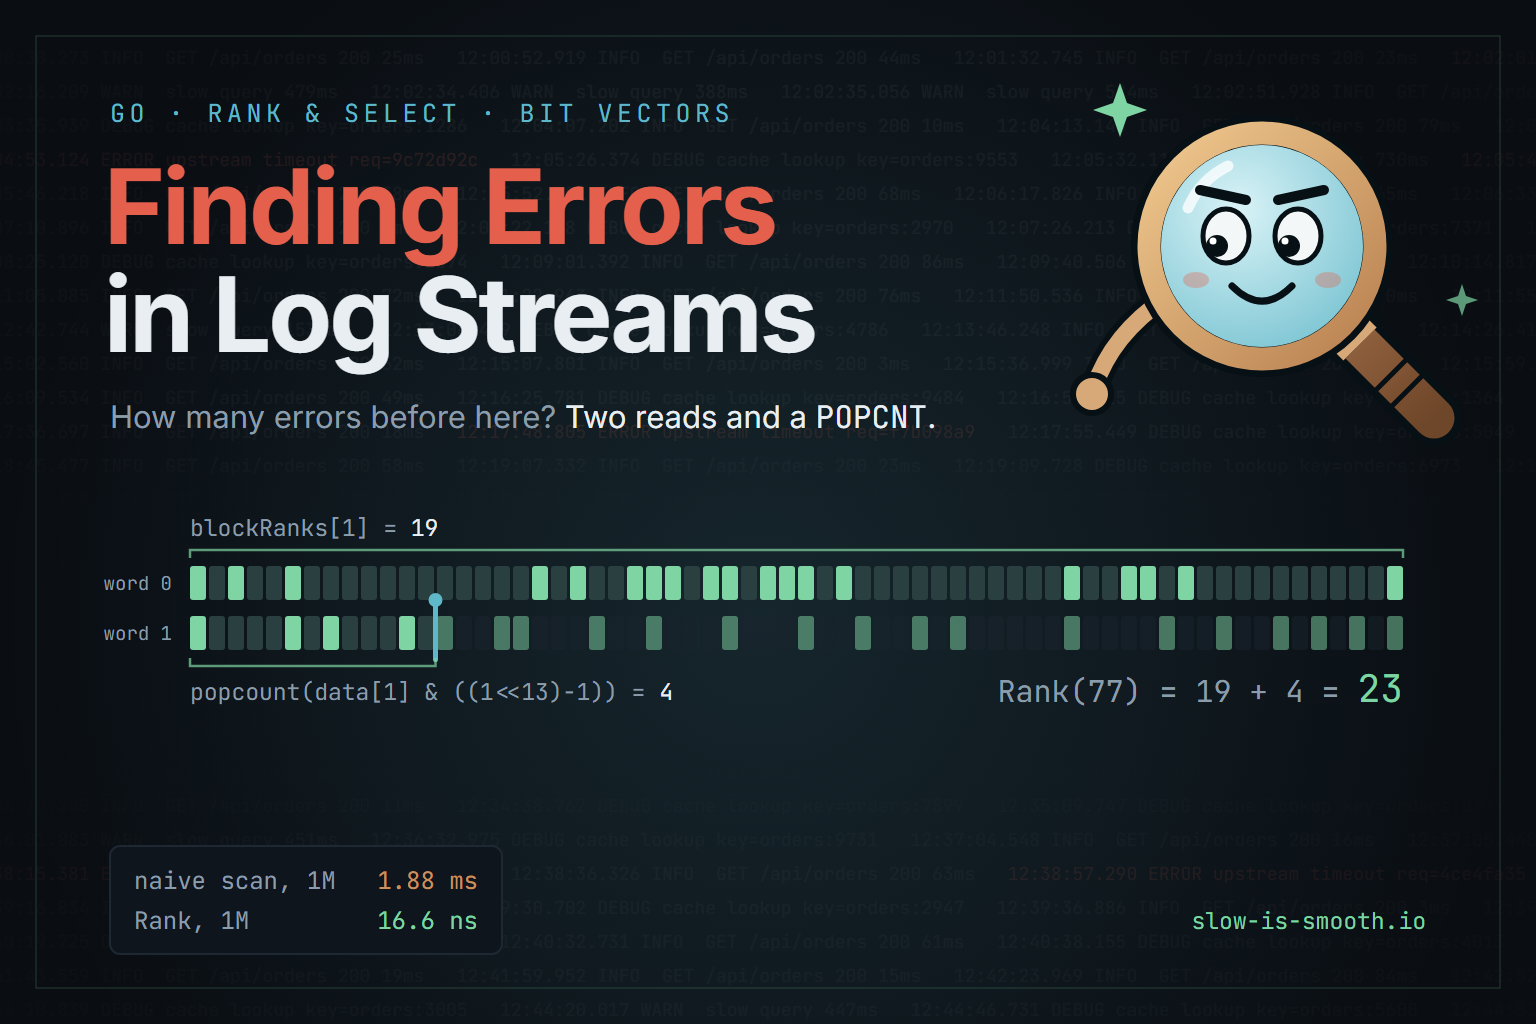
Contents
Two questions come up constantly when processing large log files:
Where is the 1000th error?
How many errors happened before this timestamp?
They look trivial. At scale they are not. The obvious implementation scans the whole dataset for every question, and with ten million entries that is ten million comparisons to answer one of them.
This post walks through how Succincter turns those scans into constant-time and near-constant-time lookups — and, just as importantly, what it costs and when it is the wrong tool.
Every number here was measured on a 13th Gen Intel Core i9-13980HX under Go 1.25.5. The raw output is in the repository.
The problem
Consider a system ingesting millions of log entries per hour:
type LogEntry struct {
    Timestamp time.Time
    Level     string // "DEBUG", "INFO", "WARN", "ERROR"
    Message   string
    RequestID string
}
A monitoring dashboard needs to answer four kinds of question:
- How many errors before entry N? — for a sparkline
- Where is the Nth error? — for “jump to error”
- How many errors between A and B? — for a time-range panel
- Show errors 100–110 — for pagination
The straightforward implementation scans from the beginning:
func CountErrorsBefore(logs []LogEntry, pos int) int {
    count := 0
    for i := 0; i < pos && i < len(logs); i++ {
        if logs[i].Level == "ERROR" {
            count++
        }
    }
    return count
}

func FindNthError(logs []LogEntry, n int) int {
    count := 0
    for i, log := range logs {
        if log.Level == "ERROR" {
            count++
            if count == n {
                return i
            }
        }
    }
    return -1
}
Both are O(n), and the constant is worse than it looks. Measured on one million
entries, CountErrorsBefore(500_000) takes 1.88 ms. A dashboard refreshing
once a second with ten such panels spends 19 ms per second — 2% of a core doing
nothing but counting.
Worse, the per-entry cost grows with the dataset, because the scan falls out of each successive cache level: 0.72 ns per entry at 10K, but 4.1 ns per entry at 10M. Linear complexity with a degrading constant.
Counting errors before position n/2
Both lanes answer the same question. Watch how much each one has to look at.
Animation speed is illustrative — the real ratio is far too large to show. Measured times are from a 13th Gen Intel Core i9-13980HX on Go 1.25.5, querying scattered positions.
Rank and Select
Both questions reduce to two classical operations on a bit vector. Build the bit
vector by marking each entry that matches a predicate — here, Level == "ERROR".
Rank(position) → count
How many 1s appear before this position?
Bit vector:  [1, 0, 1, 1, 0, 0, 1, 0, 1, 1]
Position:     0  1  2  3  4  5  6  7  8  9

Rank(0)  = 0   nothing before position 0
Rank(3)  = 2   positions 0 and 2 hold 1s
Rank(7)  = 4   positions 0, 2, 3, 6
Rank(10) = 6   every 1 in the vector
Select(n) → position
Where is the Nth 1?
Bit vector:  [1, 0, 1, 1, 0, 0, 1, 0, 1, 1]
Position:     0  1  2  3  4  5  6  7  8  9

Select(1) = 0   first 1 sits at position 0
Select(2) = 2
Select(4) = 6
Select(7) = -1  only six 1s exist
Two conventions that will bite you
These are the two things most likely to cost you an afternoon:
Rank(pos)is exclusive. It counts 1s strictly beforepos, never including the bit atpositself. SoRank(0)is always 0, andRank(len)is the total count.
Select(n)is 1-indexed.Select(1)is the first 1, notSelect(0).Select(0)returns-1, as does anynlarger than the total.
Get these backwards and you will be off by one in a way that looks almost right, which is the worst kind of wrong.
Out-of-range input is handled rather than punished. Rank clamps — negatives
return 0, anything past the end returns the total. Select returns -1. Always
check Select for -1 before using it as an index, or you will index a slice
with -1 and panic.
The duality
The two operations are inverses, which is where the useful patterns come from:
Rank(Select(n))equalsn - 1— the count before the Nth 1Select(Rank(pos) + 1)gives the position of the next 1 at or afterpos
Rank(pos): two reads, no search
Drag the marker. The answer is one stored number plus a popcount of the bits below it.
The superblock array is never touched here. It exists only to speed up
Select. Rank needs one prefix sum and one POPCNT
instruction — which is why it costs the same whether the dataset holds a
thousand entries or a billion. Note too that the mask keeps the bits
strictly below offset: that is exactly why Rank(pos)
excludes the bit at pos.
Using it
The constructor takes any slice plus a predicate. The predicate decides which elements become 1s:
package main

import (
    "fmt"
    "time"

    "github.com/shaia/succincter"
)

type LogEntry struct {
    Timestamp time.Time
    Level     string
    Message   string
}

func main() {
    logs := generateLogs(1_000_000, 0.05) // 5% errors

    errorIndex := succincter.NewSuccincter(logs, func(e LogEntry) bool {
        return e.Level == "ERROR"
    })

    // How many errors before position 500,000?
    fmt.Println(errorIndex.Rank(500_000))

    // Where is the 1000th error? Always check for -1.
    if pos := errorIndex.Select(1000); pos != -1 {
        fmt.Printf("error #1000 at %d: %s\n", pos, logs[pos].Message)
    }

    // How many errors in [100000, 200000)? Two O(1) lookups.
    inRange := errorIndex.Rank(200_000) - errorIndex.Rank(100_000)
    fmt.Println(inRange)

    // Total errors: there is no Len() or Count() — use Rank(len).
    total := errorIndex.Rank(len(logs))
    fmt.Println(total)
}
That last line is worth noting: the struct keeps its total privately, so
Rank(len(logs)) is the idiomatic way to ask “how many in total”. There is no
Count() method to hunt for.
The index is immutable once built, and safe for concurrent reads with no locking — which is exactly what you want behind a dashboard serving many requests.
The trade is simple: construction is O(n), every query after that is cheap. You pay once.
How it works
Three arrays, built once at construction.
1. The bit vector. Each element becomes one bit, packed 64 to a uint64
word. Element i lives at bit i % 64 of word i / 64 — least significant bit
first.
2. Block ranks. One uint64 per 64-bit word, holding the number of 1s in
all preceding words. An exclusive prefix sum.
3. Superblock ranks. One uint64 per 16 words, holding the same running
total, sampled every 1024 bits.
Log levels:      D  E  I  E  D  D  E  I  I  E  D  E  ...
                 ↓
Bit vector:      0  1  0  1  0  0  1  0  0  1  0  1  ...
                 └──────────── word 0 (64 bits) ────────────┘
                 ↓
blockRanks:      [0, 27, 51, 79, ...]      one entry per word
                 ↓
superBlocks:     [0, ......., 412, ...]    one entry per 16 words
Rank is two lookups
Here is the part worth internalising: Rank never reads the superblock array
at all. It needs exactly one prefix sum and one popcount.
blockIndex := pos / 64
offset     := pos % 64

rank := blockRanks[blockIndex]                          // 1s in all earlier words
rank += popcount(data[blockIndex] & ((1 << offset) - 1)) // 1s earlier in this word
The mask (1 << offset) - 1 keeps the bits below offset — which is precisely
why Rank is exclusive. The popcount compiles to a single POPCNT instruction.
Two array reads and a CPU instruction, regardless of whether the dataset holds a thousand entries or a billion. That is the O(1).
Select is a hierarchy
The superblock array earns its keep here. Select cannot jump straight to an
answer, because it is asking the inverse question — it has to search:
- Binary search the superblocks for the last entry strictly below the target rank. This narrows to a 1024-bit region. O(log n).
- Binary search the 16 block ranks inside that region. At most 4 steps.
- Scan the word for the remaining bit. At most 64 iterations.
position = blockIndex*64 + SelectInBlock(data[blockIndex], remaining)
Step 3 is a plain loop over bit positions, not a constant-time bit trick. It is
bounded at 64, not constant. That bound, plus the logarithmic first step, is why
Select is O(log n) while Rank is O(1) — and, as the benchmarks below show, why
it is roughly 25x slower in practice.
Select(n): three levels of narrowing
4,096 bits → 64 words → 4 superblocks. Step through the search the code actually performs.
Level 1 — superBlocks binary search, one entry per 1024 bits · O(log n)
Level 2 — blockRanks binary search inside a 16-word window · at most 4 steps
Level 3 — SelectInBlock plain linear scan · at most 64 iterations, not a bit trick
This is why Select is the slower of the two. Rank reads two numbers and
stops; Select has to search, and each level touches a different cache line.
Measured on 10M entries: Rank ~18 ns, Select ~533 ns. Note the binary
search returns the last entry strictly below the target — the same
exclusive convention that makes Rank exclusive.
Performance
Measured against the naive scan above. Every timed loop accumulates into a package-level sink, so the compiler cannot delete the call being measured — a trap worth knowing about, since without it these numbers collapse to meaningless near-zero values.
Rank
| Entries | Naive scan | Succincter | Speedup |
|---|---|---|---|
| 10K | 3.60 µs | 2.7 ns | ~1,300x |
| 100K | 161 µs | 14.0 ns | ~11,500x |
| 1M | 1.88 ms | 16.6 ns | ~113,000x |
| 10M | 20.6 ms | 18.0 ns | ~1,145,000x |
Select
| Entries | Naive scan | Succincter | Speedup |
|---|---|---|---|
| 10K | 4.45 µs | 228 ns | ~19x |
| 100K | 162 µs | 315 ns | ~513x |
| 1M | 1.97 ms | 423 ns | ~4,650x |
| 10M | 22.3 ms | 533 ns | ~41,900x |
Construction
| Entries | Build time |
|---|---|
| 10K | 38 µs |
| 100K | 489 µs |
| 1M | 5.1 ms |
| 10M | 52.7 ms |
A caveat about that Rank column
You will find both “~2 ns” and “~13 ns” quoted for Rank in various places. Both
are correct, and the gap is pure cache behaviour:
| Access pattern | 1M entries |
|---|---|
| Same position, over and over | 2.56 ns |
| Scattered positions | 16.6 ns |
Query one position a billion times and its three cache lines never leave L1. Query scattered positions — what a real dashboard does — and you pay for cache misses. The tables above use the scattered numbers, because they are the ones you will actually see.
Select is far more sensitive still: 17–30 ns for a repeated rank against
228–533 ns scattered, because the binary search walks roughly thirteen cold cache
lines at 10M entries.
The lesson generalises beyond this library: a microbenchmark that hammers one input measures your cache, not your algorithm.
Memory
The index costs 2.06 bits per element, from three contributions. With
B = ceil(n/64) words:
| Array | Size | Bits/element |
|---|---|---|
| Bit vector | B × 8 bytes | 1.0 |
| Block ranks | B × 8 bytes | 1.0 |
| Superblock ranks | ceil(B/16) × 8 bytes | 0.0625 |
| Total | 2.0625 |
In absolute terms:
| Entries | Index size | []bool equivalent | Saving |
|---|---|---|---|
| 1M | 252 KiB | 977 KiB | 3.9x |
| 10M | 2.46 MiB | 9.54 MiB | 3.9x |
| 100M | 24.6 MiB | 95.4 MiB | 3.9x |
Go’s []bool spends a full byte per element. Succincter stores the same
information and a rank index in less than a third of the space.
Measured heap comes out slightly higher — 2.18 bits/element at one million —
because the two index arrays are grown with append and no preallocation, leaving
capacity slack. A -benchmem run reports higher still (645 KB at 1M), but that
figure counts every intermediate allocation during growth; it is a construction
cost, not a resting footprint.
What the index costs
Three arrays, sized directly from n. Drag to see any dataset size.
Why it stops mattering how big the data is
Measured Rank latency against a naive scan. Both axes logarithmic.
| Entries | Naive scan | Succincter | Speedup |
|---|---|---|---|
| 10K | 3.60 µs | 2.7 ns | 1,300× |
| 100K | 161 µs | 14.0 ns | 11,500× |
| 1M | 1.88 ms | 16.6 ns | 113,000× |
| 10M | 20.6 ms | 18.0 ns | 1,145,000× |
The measured index runs about 6% above the formula — 2.18 bits/element
at one million — because the two index arrays grow by append with
no preallocation, leaving capacity slack. A -benchmem run reports higher
again, but that counts every intermediate allocation during growth: a construction
cost, not a resting footprint.
A note on an older number. Earlier documentation claimed ~1.5 bits/element. That was accurate when the index arrays were
[]uint32; they were widened to[]uint64to support arrays beyond 537 million elements, which raised the true cost to 2.06.
Five patterns worth stealing
1. Pagination without scanning
Jump straight to page 100. No cursor, no scan through pages 1–99.
func GetErrorPage(logs []LogEntry, index *succincter.Succincter,
                  page, pageSize int) []LogEntry {
    startRank := (page-1)*pageSize + 1 // Select is 1-indexed
    result := make([]LogEntry, 0, pageSize)

    for i := 0; i < pageSize; i++ {
        pos := index.Select(startRank + i)
        if pos == -1 {
            break // ran off the end
        }
        result = append(result, logs[pos])
    }
    return result
}
2. Time-range counts
Binary search for the boundaries, then two O(1) lookups — the count itself is free regardless of how many entries fall in the range.
func ErrorsInTimeRange(logs []LogEntry, index *succincter.Succincter,
                       start, end time.Time) int {
    startPos := sort.Search(len(logs), func(i int) bool {
        return !logs[i].Timestamp.Before(start)
    })
    endPos := sort.Search(len(logs), func(i int) bool {
        return logs[i].Timestamp.After(end)
    })
    return index.Rank(endPos) - index.Rank(startPos)
}
3. One index per severity
Indices are independent and cheap. Build several.
type LogIndices struct {
    Errors   *succincter.Succincter
    Warnings *succincter.Succincter
    Severe   *succincter.Succincter
}

func BuildIndices(logs []LogEntry) LogIndices {
    return LogIndices{
        Errors: succincter.NewSuccincter(logs, func(e LogEntry) bool {
            return e.Level == "ERROR"
        }),
        Warnings: succincter.NewSuccincter(logs, func(e LogEntry) bool {
            return e.Level == "WARN"
        }),
        Severe: succincter.NewSuccincter(logs, func(e LogEntry) bool {
            return e.Level == "ERROR" || e.Level == "WARN"
        }),
    }
}

// Three dashboard counters, three O(1) lookups.
func (idx LogIndices) GetStats(pos int) (errors, warnings, severe int) {
    return idx.Errors.Rank(pos), idx.Warnings.Rank(pos), idx.Severe.Rank(pos)
}
At 2.06 bits/element, three indices over 10M entries cost 7.4 MiB total.
4. Sampling
Every Nth error, for trend analysis over a set too large to plot whole:
func SampleErrors(logs []LogEntry, index *succincter.Succincter,
                  sampleRate int) []LogEntry {
    totalErrors := index.Rank(len(logs)) // no Count() method; this is it
    samples := make([]LogEntry, 0, totalErrors/sampleRate+1)

    for i := 1; i <= totalErrors; i += sampleRate {
        if pos := index.Select(i); pos != -1 {
            samples = append(samples, logs[pos])
        }
    }
    return samples
}
5. Surrounding context
An error alone is rarely useful; the twenty lines around it usually are.
func GetErrorWithContext(logs []LogEntry, index *succincter.Succincter,
                         errorNum, contextLines int) []LogEntry {
    errorPos := index.Select(errorNum)
    if errorPos == -1 {
        return nil
    }
    start := max(0, errorPos-contextLines)
    end := min(len(logs), errorPos+contextLines+1)
    return logs[start:end]
}
When not to use it
Succincter is a good fit for large, read-heavy, immutable datasets queried on a boolean predicate. It is a poor fit in five specific cases:
| Situation | Why it fails |
|---|---|
| Data changes often | The index is immutable. Every change means a full rebuild — 5.1 ms per million entries. |
| Fewer than ~10,000 elements | A naive scan takes microseconds. Build cost exceeds any saving. |
| You query once and discard | Construction is far more expensive than the single scan it replaces. |
| Severely memory-constrained | 2.06 bits/element is small, but not free. |
| Non-boolean predicates | COUNT WHERE value > X for varying X needs a different structure. The predicate is fixed at build time. |
That fourth column of the classic comparison is the one that decides it:
| Approach | Rank | Select | Space | Updates |
|---|---|---|---|---|
| Naive scan | O(n) | O(n) | none | O(1) |
| Prefix sums | O(1) | O(log n) | 64 bits/elem | O(n) |
| Succincter | O(1) | O(log n) | 2.06 bits/elem | immutable |
| B-tree | O(log n) | O(log n) | ~O(n) | O(log n) |
Where it does fit, it fits well beyond logs:
| Domain | Predicate | Question it answers |
|---|---|---|
| Bioinformatics | base == 'A' | Where is the Nth adenine? |
| Search engines | hasKeyword | Compressed posting lists |
| Databases | isNull | Null bitmaps for columnar storage |
| Time series | isAnomaly | Jump to the Nth anomaly |
| Finance | isTransaction | Locate transactions in an event stream |
Conclusion
If you are repeatedly asking “how many X before Y” or “where is the Nth X”, you are doing rank and select — and a scan is the wrong implementation.
The takeaways:
- Rank is genuinely O(1): one prefix-sum read plus one
POPCNT, ~17 ns at any scale. - Select is O(log n) and about 25x slower than Rank. Reach for Rank when either will do.
- 2.06 bits per element — under a third of what
[]boolcosts, index included. - The predicate is fixed at build time. That constraint is what buys the speed.
- Benchmark with scattered inputs. Hammering one position measures your cache, not your algorithm.
go get github.com/shaia/succincter
go run ./examples/loganalysis
The complete example is on GitHub, and the raw measurements behind every number above are in the repository.