The retry limit that broke a Bloom filter's one promise
 The retry limit that broke a Bloom filter's one promise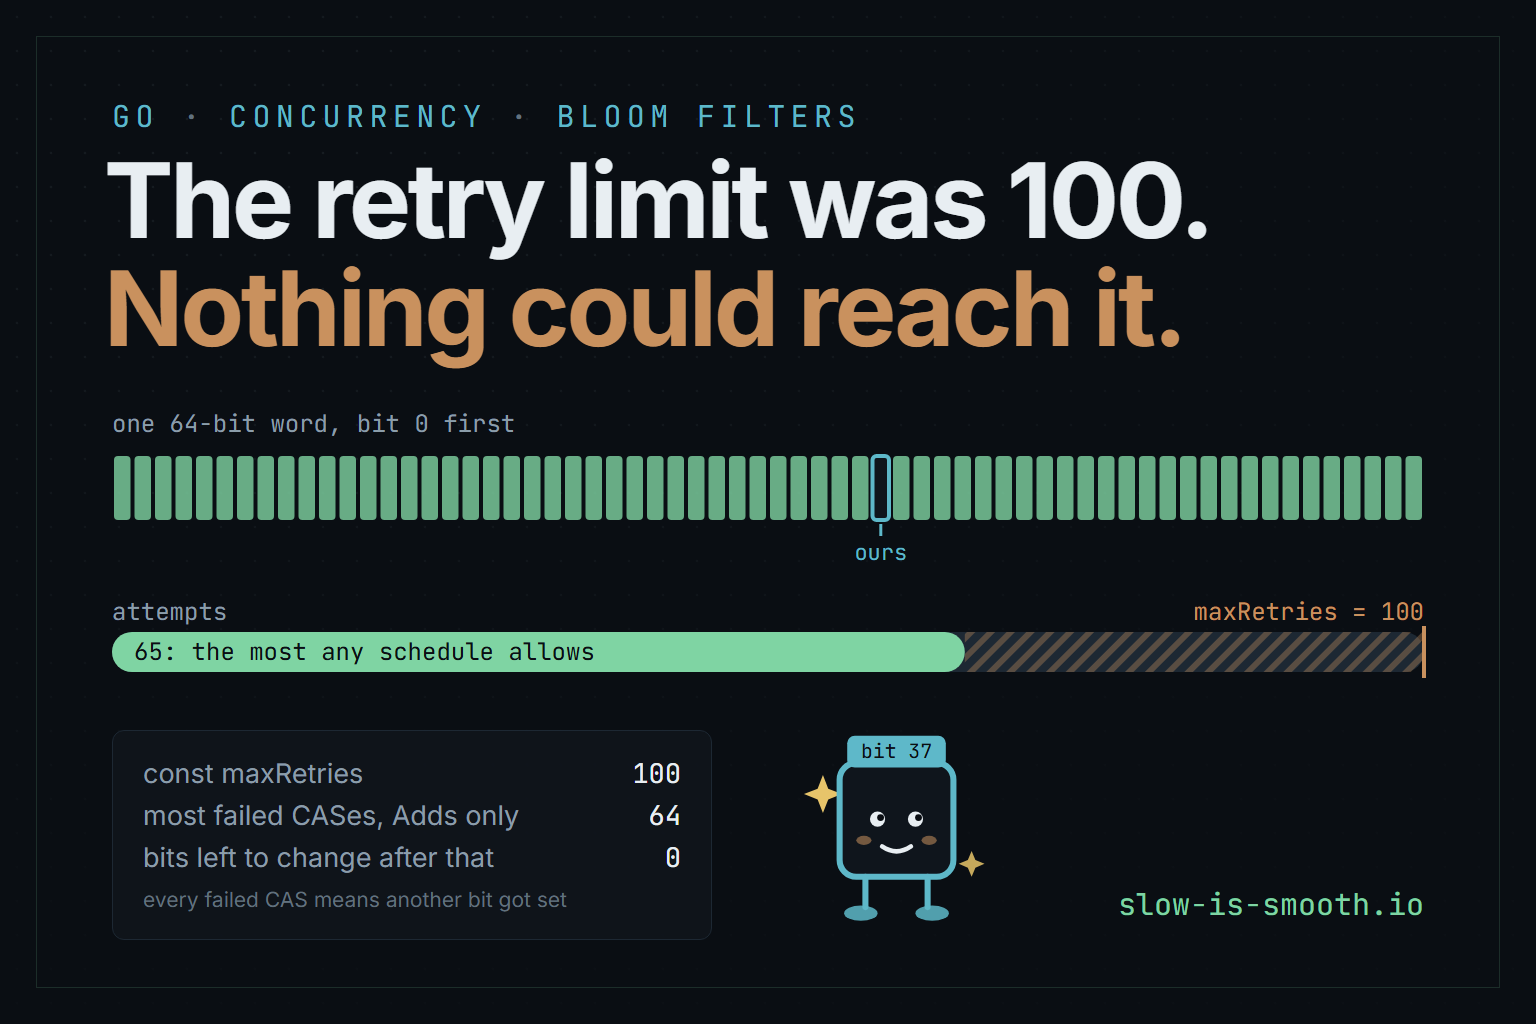
Contents
A Bloom filter makes exactly one promise: once you add a key, it will never tell you the key is absent. Last November I published a compare-and-swap loop that gave up after a hundred tries, and wrote that the bit it might leave unset was an acceptable trade-off against livelock. It was a trade against nothing. While only Adds are writing, that loop cannot fail a sixty-fifth time, let alone a hundredth. The operations that really could lose an Add were somewhere else in the library, and they never retried anything.
This post corrects Part 1, and the benign-read post that called the same loop correct. It is also what turned up once I stopped arguing about the loop and ran it: a bound small enough to check by hand, a test that could not fail but could hang, and two bulk operations that lose nearly half of a burst of concurrent Adds while the race detector reports nothing.
The promise
A Bloom filter is an array of bits. Adding a key hashes it to a handful of positions (six, for the filters in this post) and sets those bits. Asking whether a key is present checks the same positions: if any of them is clear, the key was never added. If all of them are set, it probably was, because other keys may have set those bits too. That “probably” is the false-positive rate, and you choose it when you size the filter.
The other direction has no probability attached. A bit that has been set stays set, so a key that was added always finds its bits. No false negatives, ever. That is the whole contract, and it holds only as long as no set bit is ever lost.
The loop
Setting a bit is word |= mask, and under concurrency that is three steps (load, OR, store) with
room for two goroutines to load the same value and for one to overwrite the other’s bit. Part 1
walked through that race. Its fix was a compare-and-swap loop, and this is the listing it printed
as the final version:
// bloomfilter.go (Final Version)
mask := uint64(1 << op.BitOffset)
wordPtr := &cacheLine.words[op.WordIdx]

const maxRetries = 100
for retry := 0; retry < maxRetries; retry++ {
    // 1. ATOMIC READ: Safely get the current value.
    old := atomic.LoadUint64(wordPtr)

    // 2. MODIFY: Calculate the new value in a local variable.
    new := old | mask

    // 3. ATOMIC COMPARE-AND-SWAP:
    // Try to write 'new', but ONLY if the value is still 'old'.
    if old == new || atomic.CompareAndSwapUint64(wordPtr, old, new) {
        // Success! Either:
        // a) The bit was already set (old == new), so we're done.
        // b) We successfully swapped 'old' for 'new'.
        break
    }
    // 4. BACKOFF: We failed. Another goroutine changed the value.
    //    Spin briefly to reduce cache line bouncing.
    if retry > 10 {
        for i := 0; i < retry; i++ {
            // Spin briefly
        }
    }
}
// Note: After maxRetries, the bit may remain unset.
// This is an acceptable trade-off in a bloom filter to
// prevent a livelock under extreme contention.
Beneath it the post said: “This hardened loop guarantees that no write is lost in the common case and prevents a CPU-wasting infinite spin under pathological contention.”
Read the note at the bottom again. A data structure whose only guarantee is “no false negatives” was documented as producing them on purpose, to avoid a livelock. That trade is only worth weighing if the livelock can happen. It can’t, and the reason takes a paragraph.
Compare-and-swap, from nothing
atomic.CompareAndSwapUint64(ptr, old, new) does one thing without interruption: if *ptr still
holds old, it stores new and returns true; otherwise it changes nothing and returns false. The
loop around it is the standard shape. Load the word, compute the word with your bit set, and swap
it in only if nobody has touched the word since you loaded it. If somebody has, go round again.
Two facts about that false matter here.
First, in Go it means exactly one thing: the value was different. It cannot fail spuriously. On
amd64 the call is a single LOCK CMPXCHGQ; on arm64 it is either CASALD, or a
load-exclusive/store-exclusive loop that retries by itself when the store fails for any other
reason. (That is from the go1.25.5 runtime source, internal/runtime/atomic.)
Second, as long as every writer uses a CAS, a failure is always somebody’s success. If your CAS failed, another goroutine’s write changed the word, so some goroutine made progress. That alone rules out livelock, which is every goroutine retrying while none gets anywhere.
But a stronger statement is available, and it is the one that makes the limit pointless.
Why the hundredth try never comes
List everything that writes to a word while Adds are running. Every Add, and AddBatch, which
uses the same loop, does one thing: turn one bit on, with a CAS. Nothing turns a bit off. So a word
only ever gains bits.
Now follow one Add that wants bit 37, and call it ours. It loads the word, bit 37 is clear, and
the CAS fails. A CAS fails only if the word changed, and in a word that only gains bits, changed
means at least one more bit is set than when we loaded it. The loop loads that fuller word. If the
new bit is 37 (another key hashed there too) then old == new, and the loop leaves without trying
a CAS: the bit is set, which is all we wanted. Otherwise that failure has used up one of the other
63 bits.
Every failure uses up another. After 63 of them there is nothing left to set except bit 37 itself.
The next CAS either succeeds, or fails because someone else set 37, and then the next load takes
the fast path out. At most 64 failures, and at most 65 trips round the loop. maxRetries = 100 sits
35 iterations past anything the loop can do.
The obvious count is 63, one per other bit. It is 64 because the change behind the last failure can be our own bit, set by somebody else.
That bound holds for every call, whatever the scheduler does. The textbook word for it is wait-free: each caller finishes in a bounded number of its own steps, rather than merely “somebody makes progress”. It is a better property than the one the limit was trying to buy, and the loop had it all along. Try to break it:
You are every other goroutine
Our Add has loaded this 64-bit word and wants bit 37. Whatever you do now happens after its Load and before its CAS. Click any clear bit to have another Add set it.
The loop is the pre-fix one from commit 4b27e48, and it stops where the reducer in
this post stops: 63 failed CASes at most while only Adds write, 64 if one of them sets bit 37
itself, and 100, with the bit lost, only once a Clear joins in. Union loses the bit with no
failed CAS at all.
Playing the scheduler
Proofs about interleavings are exactly the kind of thing I get wrong, so here is one you can run.
It takes the loop from commit 4b27e48, the version Part 1 printed, and reaches
atomic.LoadUint64 and atomic.CompareAndSwapUint64 through two function parameters. Whatever the
CAS parameter does to the word before it really compares is, as far as the loop can tell, another
goroutine writing at the worst possible moment. There are no goroutines and no timing in it, so
every run is the same run. Save it as main.go:
// R1: the pre-fix retry loop, with you as the scheduler.
//
// preFix is the inner loop of setBitCacheOptimized from commit 4b27e48,
// verbatim except that it reaches atomic.LoadUint64 and
// atomic.CompareAndSwapUint64 through two parameters. Whatever the cas
// parameter does to the word before it really compares is, as far as the
// loop can tell, another goroutine writing at the worst possible moment.
//
// Run: go run main.go
package main

import (
	"fmt"
	"math/bits"
	"sync/atomic"
)

func preFix(wordPtr *uint64, mask uint64,
	load func(*uint64) uint64, cas func(*uint64, uint64, uint64) bool) {
	const maxRetries = 100
	for retry := 0; retry < maxRetries; retry++ {
		old := load(wordPtr)
		new := old | mask
		if old == new || cas(wordPtr, old, new) {
			break
		}
		// Brief pause on contention to reduce cache line bouncing
		if retry > 10 {
			// Use a minimal yield-like behavior for heavy contention
			for i := 0; i < retry; i++ {
				// Spin briefly to allow other goroutines to complete
			}
		}
	}
}

const ours = 37 // the bit our Add wants

// setAnother plays an Add of some other key: it sets the lowest clear bit
// that is not ours. One goroutine runs all of this, so plain writes are fine.
func setAnother(w *uint64) bool {
	free := ^*w &^ (1 << ours)
	if free == 0 {
		return false
	}
	*w |= 1 << bits.TrailingZeros64(free)
	return true
}

type scenario struct {
	name   string
	meddle func(w *uint64) // runs after our Load, before our CAS
	after  func(w *uint64) // runs once the loop has returned
}

func main() {
	var snap uint64
	var loaded bool
	scenarios := []scenario{
		{"another Add sets a bit, every time", func(w *uint64) { setAnother(w) }, nil},
		{"...and when none is left, sets ours", func(w *uint64) {
			if !setAnother(w) {
				*w |= 1 << ours
			}
		}, nil},
		{"an Add and a Clear take turns", func(w *uint64) {
			if *w == 0 {
				*w = 1
			} else {
				*w = 0
			}
		}, nil},
		{"a Union(empty) straddles our CAS",
			func(w *uint64) { // the kernel's VMOVDQU load
				if !loaded {
					snap, loaded = *w, true
				}
			},
			func(w *uint64) { *w = snap | 0 }}, // VPOR with zeros, VMOVDQU store
	}

	fmt.Printf("%-38s %8s %8s  %-5s  %s\n", "scenario", "failures", "attempts", "exit", "our bit set")
	for _, s := range scenarios {
		var word uint64
		failures, attempts := 0, 0
		won, sawOurs := false, false
		load := func(p *uint64) uint64 {
			attempts++
			v := atomic.LoadUint64(p)
			sawOurs = v&(1<<ours) != 0
			return v
		}
		cas := func(p *uint64, old, new uint64) bool {
			s.meddle(p)
			if atomic.CompareAndSwapUint64(p, old, new) {
				won = true
				return true
			}
			failures++
			return false
		}

		preFix(&word, 1<<ours, load, cas)

		exit := "limit"
		if won {
			exit = "cas"
		} else if sawOurs {
			exit = "fast"
		}
		if s.after != nil {
			s.after(&word)
		}
		fmt.Printf("%-38s %8d %8d  %-5s  %v\n", s.name, failures, attempts, exit, word&(1<<ours) != 0)
	}

	fmt.Println()
	for _, touchOurs := range []bool{false, true} {
		most, schedules := worst(8, touchOurs)
		fmt.Printf("every schedule, 8 clear bits, others may set ours=%-5v: most failures %d (%d schedules)\n",
			touchOurs, most, schedules)
	}
}

// needChoice stops a replay at the first CAS the script has no entry for.
type needChoice struct{ word uint64 }

// worst replays preFix under every schedule an adversary can choose when
// only the low `free` bits of the word start clear: before each of our
// CASes it may set any clear bits (ours too, if touchOurs), or none.
// It returns the most CAS failures any schedule forces.
func worst(free int, touchOurs bool) (most, schedules int) {
	const mine = uint64(1 << 3)
	var explore func(script []uint64)
	explore = func(script []uint64) {
		word := ^uint64(0) << free
		step, failures := 0, 0
		var pending *needChoice
		func() {
			defer func() {
				if r := recover(); r != nil {
					pending = r.(*needChoice)
				}
			}()
			preFix(&word, mine,
				func(p *uint64) uint64 { return atomic.LoadUint64(p) },
				func(p *uint64, old, new uint64) bool {
					if step == len(script) {
						panic(&needChoice{*p})
					}
					*p = script[step]
					step++
					if atomic.CompareAndSwapUint64(p, old, new) {
						return true
					}
					failures++
					return false
				})
		}()
		if pending == nil {
			schedules++
			most = max(most, failures)
			return
		}
		choices := ^pending.word
		if !touchOurs {
			choices &^= mine
		}
		for sub := choices; ; sub = (sub - 1) & choices {
			explore(append(script[:len(script):len(script)], pending.word|sub))
			if sub == 0 {
				break
			}
		}
	}
	explore(nil)
	return most, schedules
}
$ go run main.go
scenario                               failures attempts  exit   our bit set
another Add sets a bit, every time           63       64  cas    true
...and when none is left, sets ours          64       65  fast   true
an Add and a Clear take turns               100      100  limit  false
a Union(empty) straddles our CAS              0        1  cas    false

every schedule, 8 clear bits, others may set ours=false: most failures 7 (94586 schedules)
every schedule, 8 clear bits, others may set ours=true : most failures 8 (283757 schedules)
The first row is the bound. An adversary that sets a fresh bit before every one of our CASes gets 63 failures, and then it has no fresh bits left. The second row is the 64th, where the last change is our own bit. The third row is the only way to reach the limit: a writer that clears bits can hand the loop a changed word forever, and after the hundredth failure the loop gives up with bit 37 clear. Hold on to the fourth row for later. The loop succeeds on its first try, and the bit is gone anyway.
The last two lines test the argument rather than the arithmetic. With 8 clear bits instead of 64,
worst replays the loop under every schedule an adversary could choose (any subset of the clear
bits set before each CAS, or none) and reports the most failures any of them forces: 7 across
94,586 schedules, or 8 across 283,757 when other writers may set ours. That is the 63-or-64 bound,
at a width small enough to enumerate. At 64 bits, enumeration is out of the question, and the
argument is what carries it there.
What real goroutines do
R1 hands the loop its worst moment on purpose. Real goroutines are much less inventive. R2 releases 64 goroutines at once, each setting its own bit of one shared word with the same loop, 20,000 rounds in a row, and counts how many times each call’s CAS failed:
$ go run main.go
GOMAXPROCS=1             calls 1280000, failed at least once 0, most failures in one call 0, used all 100: 0, rounds ending with a bit clear: 0  [120ms]
  failures:calls
GOMAXPROCS=8             calls 1280000, failed at least once 12172, most failures in one call 4, used all 100: 0, rounds ending with a bit clear: 0  [989ms]
  failures:calls  1:11940 2:227 3:3 4:2
GOMAXPROCS=32            calls 1280000, failed at least once 21833, most failures in one call 4, used all 100: 0, rounds ending with a bit clear: 0  [12.848s]
  failures:calls  1:21128 2:665 3:34 4:6
GOMAXPROCS=32, Clear     calls 1280000, failed at least once 25838, most failures in one call 6, used all 100: 0  [13.814s]
  failures:calls  1:19577 2:5812 3:362 4:73 5:11 6:3
On 32 threads, 1.7% of calls failed at least once, and the worst of 1,280,000 calls failed four
times. A goroutine zeroing the word in a tight loop, standing in for Clear, pushed that to six.
No call came near 100, and no round ended with a bit missing. The spin in the original loop only
runs once a call has failed twelve times, so across 5,120,000 calls it never ran at all.
R2 in full: 64 goroutines, one word
// R2: the same loop, 64 real goroutines, one word.
//
// Each round, 64 goroutines are released together and each sets its own bit
// of one shared word with the pre-fix loop, counting its failed CASes. The
// word is reset between rounds, while every worker is idle.
//
// Run: go run main.go
package main

import (
	"fmt"
	"runtime"
	"sync"
	"sync/atomic"
	"time"
)

// preFix is the loop from commit 4b27e48, counting its failed CASes.
func preFix(wordPtr *uint64, mask uint64) (failures int) {
	const maxRetries = 100
	for retry := 0; retry < maxRetries; retry++ {
		old := atomic.LoadUint64(wordPtr)
		new := old | mask
		if old == new || atomic.CompareAndSwapUint64(wordPtr, old, new) {
			break
		}
		failures++
		// Brief pause on contention to reduce cache line bouncing
		if retry > 10 {
			// Use a minimal yield-like behavior for heavy contention
			for i := 0; i < retry; i++ {
				// Spin briefly to allow other goroutines to complete
			}
		}
	}
	return failures
}

const workers = 64

// trial returns, for each failure count 0..100, how many calls failed that
// many times, and how many rounds ended with a bit still clear. clearing adds
// a goroutine that zeroes the word in a loop, as a concurrent Clear would.
func trial(procs, rounds int, clearing bool) (hist [101]int64, short int) {
	runtime.GOMAXPROCS(procs)

	var word uint64
	var round, finished atomic.Int64
	var stop atomic.Bool
	var exited sync.WaitGroup
	perWorker := make([][101]int64, workers)

	for w := 0; w < workers; w++ {
		exited.Add(1)
		go func(w int) {
			defer exited.Done()
			for seen := int64(0); ; {
				r := round.Load()
				if r < 0 {
					return
				}
				if r == seen {
					runtime.Gosched()
					continue
				}
				seen = r
				perWorker[w][preFix(&word, 1<<w)]++
				finished.Add(1)
			}
		}(w)
	}
	if clearing {
		exited.Add(1)
		go func() {
			defer exited.Done()
			for !stop.Load() {
				atomic.StoreUint64(&word, 0)
			}
		}()
	}

	for r := int64(1); r <= int64(rounds); r++ {
		atomic.StoreUint64(&word, 0)
		finished.Store(0)
		round.Store(r)
		for finished.Load() < workers {
			runtime.Gosched()
		}
		if atomic.LoadUint64(&word) != ^uint64(0) {
			short++
		}
	}
	round.Store(-1)
	stop.Store(true)
	exited.Wait()

	for w := range perWorker {
		for f, n := range perWorker[w] {
			hist[f] += n
		}
	}
	return hist, short
}

func report(name string, hist [101]int64, short int, took time.Duration) {
	var calls, failed int64
	most := 0
	for f, n := range hist {
		calls += n
		if f > 0 {
			failed += n
		}
		if n > 0 {
			most = f
		}
	}
	fmt.Printf("%-24s calls %d, failed at least once %d, most failures in one call %d, used all 100: %d",
		name, calls, failed, most, hist[100])
	if short >= 0 {
		fmt.Printf(", rounds ending with a bit clear: %d", short)
	}
	fmt.Printf("  [%v]\n", took.Round(time.Millisecond))
	fmt.Print("  failures:calls ")
	for f := 1; f <= 100; f++ {
		if hist[f] > 0 {
			fmt.Printf(" %d:%d", f, hist[f])
		}
	}
	fmt.Println()
}

func main() {
	const rounds = 20_000
	for _, procs := range []int{1, 8, runtime.NumCPU()} {
		start := time.Now()
		hist, short := trial(procs, rounds, false)
		report(fmt.Sprintf("GOMAXPROCS=%d", procs), hist, short, time.Since(start))
	}
	start := time.Now()
	hist, _ := trial(runtime.NumCPU(), rounds, true)
	report(fmt.Sprintf("GOMAXPROCS=%d, Clear", runtime.NumCPU()), hist, -1, time.Since(start))
}
Right fix, wrong reasons
The limit came out in commit db8ebf7, which replaced the loop with for {}. That is the right
code, and the comment above it gives the wrong reason:
The probability of 100+ consecutive failures is astronomically low
It isn’t a probability. While only Adds write, 65 consecutive failures cannot happen. The rest of the comment (“512 bits per cache line and typical hash distributions”) argues about how likely an outcome is when the shape of the word already rules it out. The bound doesn’t depend on how many bits a cache line holds or how evenly keys hash. It depends on no writer ever clearing a bit.
The timeline is kinder to the code than to the post. The limit and its spin arrived in 4b27e48,
on the evening of 1 November 2025. By 11:00 the next morning the spin was gone (090e9d6), and at
11:46 the limit went too (db8ebf7). Part 1 was published at 21:27 that evening, presenting the
version from the night before as final.
4b27e48’s commit message called the spin “exponential backoff after 10 retries”. It is a
countdown of retry iterations, so it is linear, and even its longest pause is 99 trips round a
three-instruction loop. I half expected the compiler to have deleted an empty loop. It hadn’t. This
is setBitCacheOptimized from the 4b27e48 tree, through go tool objdump, trimmed to line and
instruction:
bloomfilter.go:519  CMPQ CX, $0xa
bloomfilter.go:519  JLE 0x140088c1d
bloomfilter.go:512  MOVQ CX, BX
bloomfilter.go:519  JMP 0x140088c6e
bloomfilter.go:521  DECQ CX
bloomfilter.go:521  TESTQ CX, CX
bloomfilter.go:521  JG 0x140088c6b
The spin survives as DECQ, TESTQ, JG, and R2 says it never mattered.
The fix’s commit message also claims “22M+ writes/sec with 50 concurrent goroutines”, and its doc
comment claims 14M+. Both come from TestConcurrentWrites, whose timed region formats every key
with fmt.Sprintf and then adds it. R5 runs that timed region twenty times as written, and twenty
times with the AddString call deleted:
$ go run .
Sprintf + AddString        median  45.2M/s  (min  20.8M, max  89.7M)
Sprintf, no filter at all  median  31.0M/s  (min  22.7M, max  96.5M)
Taking the Bloom filter out did not make the number go up. Both ranges span more than a factor of
four, so whatever 22M and 14M measured, it was goroutine start-up and Sprintf with some noise on
top, and not the loop. The test itself can’t tell the two loops apart either: run at ef46d38,
the last commit with the limit, and at db8ebf7, alternating, 30 runs each, it reports medians
of 27.7M and 27.2M writes a second, over ranges of 14–47M and 16–48M.
R5 in full: the test's timed region, with and without the filter
// R5: what "22M+ writes/sec" measured.
//
// rate is the timed region of TestConcurrentWrites as it stood at db8ebf7:
// 50 goroutines, 1,000 keys each, fmt.Sprintf then AddString. main runs it
// as written and with the AddString taken out, alternating, 20 times each.
//
// Run: go mod init r5 && go get github.com/shaia/BloomFilter@c2a293b && go run .
package main

import (
	"fmt"
	"slices"
	"sync"
	"time"

	bloomfilter "github.com/shaia/BloomFilter"
)

func rate(add bool) float64 {
	bf := bloomfilter.NewCacheOptimizedBloomFilter(100_000, 0.01)

	numGoroutines := 50
	numWritesPerGoroutine := 1000

	var wg sync.WaitGroup
	startTime := time.Now()

	for g := 0; g < numGoroutines; g++ {
		wg.Add(1)
		go func(goroutineID int) {
			defer wg.Done()

			for i := 0; i < numWritesPerGoroutine; i++ {
				key := fmt.Sprintf("g%d_key_%d", goroutineID, i)
				if add {
					bf.AddString(key)
				}
			}
		}(g)
	}

	wg.Wait()
	totalTime := time.Since(startTime)
	totalWrites := numGoroutines * numWritesPerGoroutine
	return float64(totalWrites) / totalTime.Seconds()
}

func main() {
	var with, without []float64
	for i := 0; i < 20; i++ {
		with = append(with, rate(true))
		without = append(without, rate(false))
	}
	slices.Sort(with)
	slices.Sort(without)
	show := func(name string, r []float64) {
		fmt.Printf("%-26s median %5.1fM/s  (min %5.1fM, max %5.1fM)\n",
			name, r[len(r)/2]/1e6, r[0]/1e6, r[len(r)-1]/1e6)
	}
	show("Sprintf + AddString", with)
	show("Sprintf, no filter at all", without)
}
Where the bound ends
Everything so far assumed that only Adds write. The library has three more writers: Clear,
Union and Intersection. None of them uses a CAS. They hand the filter’s memory to SIMD kernels,
and on this machine those are AVX2 loops that work on 32 bytes, four words, at a time. This is the
heart of Union, from internal/simd/amd64/avx2.s:
    // Load 32 bytes from src and dst
    VMOVDQU (SI)(DX*1), Y0   // Load src
    VMOVDQU (DI)(DX*1), Y1   // Load dst

    // Perform OR operation
    VPOR Y0, Y1, Y1          // dst = dst | src

    // Store result back to dst
    VMOVDQU Y1, (DI)(DX*1)
Load, combine, store. That file is byte-for-byte the same at 4b27e48 and today (git rev-parse
gives the same blob at both), so everything below was already true when Part 1 went out.
Clear breaks the bound, but not the promise. Clear stores zeros, so a word no longer only
gains bits, and the counting argument falls apart: R1’s third row drives the loop all the way to its
limit. The unlimited loop inherits the same weakness in principle, since with bits being cleared no
number of attempts is guaranteed, though R2 never saw more than six. But losing a key to a
concurrent Clear is not a broken promise. If an Add and a Clear overlap and the key ends up
absent, that is exactly what “the Add happened first” looks like. Nobody is owed that key.
Union breaks the promise, and no CAS fails. On its own, Union(empty) changes nothing: it
ORs every word with zero. Beside an Add, it can load a block, let the Add’s CAS succeed, and then
store the block it loaded, writing a zero back over the one the Add had just written. That is R1’s
fourth row, and no ordering of the two calls explains the result. Had the Union finished first,
the bit would still be set. Had the Add finished first, the Union would have loaded the bit and
stored it back. Intersection has the same store, and intersecting a filter with itself is its own
no-op. (A real Union with a non-empty filter has the same problem, since a union can only add
bits. A real Intersection is murkier, because losing a key the other filter lacks can be
legitimate; intersecting with itself isolates the part that can’t be.)
Here is the library as it stands today, pinned to commit c2a293b. Eight goroutines add 10,000
distinct keys while a ninth runs one other operation in a loop, and then every key is looked up:
// R3: losing an Add with no retry limit anywhere.
//
// Eight goroutines Add 10,000 distinct keys to the library as it stands
// today, while a ninth runs one other operation in a loop. Then every key is
// looked up. A Bloom filter must find all of them.
//
// Run: go mod init r3 && go get github.com/shaia/BloomFilter@c2a293b && go run .
package main

import (
	"fmt"
	"runtime"
	"slices"
	"sync"
	"sync/atomic"

	bloomfilter "github.com/shaia/BloomFilter"
)

type filter = bloomfilter.CacheOptimizedBloomFilter

const keys = 10_000

// missing adds every key while `other` runs in a loop beside the writers,
// then counts the keys the filter says it has never seen.
func missing(procs int, other func(bf *filter)) int {
	runtime.GOMAXPROCS(procs)
	bf := bloomfilter.NewCacheOptimizedBloomFilter(keys, 0.01)

	var stop atomic.Bool
	var bystander sync.WaitGroup
	if other != nil {
		bystander.Add(1)
		go func() {
			defer bystander.Done()
			for !stop.Load() {
				other(bf)
			}
		}()
	}

	const writers = 8
	var wg sync.WaitGroup
	for w := 0; w < writers; w++ {
		wg.Add(1)
		go func(w int) {
			defer wg.Done()
			for k := w * keys / writers; k < (w+1)*keys/writers; k++ {
				bf.AddUint64(uint64(k))
			}
		}(w)
	}
	wg.Wait()
	stop.Store(true)
	bystander.Wait()

	n := 0
	for k := 0; k < keys; k++ {
		if !bf.ContainsUint64(uint64(k)) {
			n++
		}
	}
	return n
}

func main() {
	empty := bloomfilter.NewCacheOptimizedBloomFilter(keys, 0.01)
	all := runtime.NumCPU()
	fmt.Printf("%d cache lines: below 4,096, so Union and Intersection run on one goroutine\n\n",
		empty.GetCacheStats().CacheLineCount)

	rows := []struct {
		name  string
		procs int
		other func(bf *filter)
	}{
		{"nothing", all, nil},
		{"PopCount", all, func(bf *filter) { bf.PopCount() }},
		{"Union(empty), GOMAXPROCS=1", 1, func(bf *filter) { bf.Union(empty) }},
		{"Union(empty)", all, func(bf *filter) { bf.Union(empty) }},
		{"Intersection(itself)", all, func(bf *filter) { bf.Intersection(bf) }},
		{"Clear", all, func(bf *filter) { bf.Clear() }},
	}

	fmt.Printf("%-28s  keys missing of %d, 10 runs: min / median / max\n", "running beside the Adds", keys)
	for _, row := range rows {
		var got []int
		for run := 0; run < 10; run++ {
			got = append(got, missing(row.procs, row.other))
		}
		slices.Sort(got)
		fmt.Printf("%-28s  %5d / %5d / %5d\n", row.name, got[0], got[len(got)/2], got[len(got)-1])
	}
}
$ go run .
188 cache lines: below 4,096, so Union and Intersection run on one goroutine

running beside the Adds       keys missing of 10000, 10 runs: min / median / max
nothing                           0 /     0 /     0
PopCount                          0 /     0 /     0
Union(empty), GOMAXPROCS=1        0 /     0 /     0
Union(empty)                    288 /  4660 /  6003
Intersection(itself)           1838 /  5115 /  5909
Clear                         10000 / 10000 / 10000
nothing and PopCount, which only reads, are the controls. The GOMAXPROCS=1 row is the one that
says the loss comes from interleaving: with a single thread, nothing runs in the middle of a kernel
pass, because the runtime won’t preempt a goroutine inside assembly (runtime/preempt.go declines
with “This is assembly code. Don’t assume it’s well-formed.”). Give the same loop 32 threads and
the median run loses 4,660 keys out of 10,000. Clear loses all of them, every time, and
legitimately: the last Clear ran after the last Add.
That rate is far higher than a three-instruction window between a load and a store would suggest. I
haven’t taken apart why. The writers and the kernel fighting over the same cache lines is the
obvious suspect. It doesn’t change the conclusion: the rate belongs to this benchmark, but the loss
belongs to the code, and R1 shows it with one Add and one Union.
Then I ran the same program under the race detector. It needs cgo, which my Windows toolchain doesn’t have, so this run is in WSL on the same machine:
$ go run -race . ; echo "exit $?"
188 cache lines: below 4,096, so Union and Intersection run on one goroutine

running beside the Adds       keys missing of 10000, 10 runs: min / median / max
nothing                           0 /     0 /     0
PopCount                          0 /     0 /     0
Union(empty), GOMAXPROCS=1        0 /     0 /     0
Union(empty)                   3053 /  4866 /  4959
Intersection(itself)           2163 /  4681 /  4947
Clear                         10000 / 10000 / 10000
exit 0
The same losses, not one DATA RACE report, and exit status 0. The benign-read post ended on
“Trust the race detector. Always.” This is where that stops working. The detector sees the memory
accesses the Go compiler instruments, and sync/atomic calls go through hooks of its own. The
kernels are hand-written assembly, which the compiler never sees. Of the two sides of this race, it
can only watch the one that was written correctly.
The library’s README, meanwhile, lists all three under “Bulk operations (SIMD accelerated, thread-safe)”.
The test that could not fail
The same batch of commits added a file of retry tests, bloomfilter_retry_test.go, including one
meant to catch the loop hanging. This is TestNoHangUnderContention as it stood before commit
0886ba7:
func TestNoHangUnderContention(t *testing.T) {
	done := make(chan bool, 1)

	go func() {
		bf := bloomfilter.NewCacheOptimizedBloomFilter(1000, 0.01)

		const numGoroutines = 100
		var wg sync.WaitGroup

		for g := 0; g < numGoroutines; g++ {
			wg.Add(1)
			go func(id int) {
				defer wg.Done()
				for i := 0; i < 100; i++ {
					bf.AddUint64(uint64(i))
				}
			}(g)
		}

		wg.Wait()
		done <- true
	}()

	// Wait for completion or timeout
	select {
	case <-done:
		t.Log("SUCCESS: Retry mechanism completed without hanging")
	case <-func() chan bool {
		timeout := make(chan bool, 1)
		go func() {
			// 10 seconds should be more than enough for 10,000 insertions
			// If it takes longer, something is wrong
			select {
			case <-done:
				return
			case <-make(chan struct{}):
				// Never triggered, just for type compatibility
			}
		}()
		return timeout
	}():
		t.Fatal("CRITICAL: Retry mechanism appears to have hung (timeout exceeded)")
	}
}
The second case receives from timeout, and nothing ever sends on timeout, so that case can never
be chosen. The test could pass, or it could hang. It could not fail. Seventeen minutes later, commit
0886ba7 noticed, and replaced the case with time.After(10 * time.Second).
Its message doesn’t mention the goroutine that the function literal starts. That helper waits on
done as well, and done only ever receives one value. Usually the test goroutine is already
queued on done when the value arrives, so it takes it and passes, and the helper stays parked
forever: one leaked goroutine for every passing run. But Go evaluates a select’s channel
expressions on entry, before it waits on any of them, so the helper is started while the test
goroutine is still setting up its select. If another thread picks the helper up in that window,
the helper is first in line. It takes the value and returns, and the test waits on a channel that
will never receive again, beside a case that could never fire.
That is not hypothetical. I built the test at 0886ba7^ and ran it 10,000 times in a row on Linux.
It passed 1,189 times, and then it stopped:
$ go test -v -run '^TestNoHangUnderContention$' -count=10000 -timeout=2m ./tests/integration
...
--- PASS: TestNoHangUnderContention (0.00s)
=== RUN   TestNoHangUnderContention
panic: test timed out after 2m0s
	running tests:
		TestNoHangUnderContention (2m0s)
The goroutine dump that follows tells the whole story in two stacks. The test goroutine is still
in its select:
goroutine 122593 [select]:
github.com/shaia/BloomFilter/tests/integration_test.TestNoHangUnderContention(0xc000596540)
	…/tests/integration/bloomfilter_retry_test.go:204 +0xaf
And 1,189 goroutines like this one are parked in the helper’s select, one left behind by each run
that passed:
goroutine 1064 [select, 2 minutes]:
github.com/shaia/BloomFilter/tests/integration_test.TestNoHangUnderContention.func2.1()
	…/tests/integration/bloomfilter_retry_test.go:212 +0x5e
created by github.com/shaia/BloomFilter/tests/integration_test.TestNoHangUnderContention.func2 in goroutine 1062
	…/tests/integration/bloomfilter_retry_test.go:209 +0x66
The helper from the run that hung isn’t in the dump at all. It took the value and returned.
I ran it three more times. Two attempts passed all 10,000 runs, and the third hung after 8,272. On
Windows, the same test passed 60,000 runs without hanging once. Under CI’s own configuration,
-race -short on Linux, it passed 2,000 runs. And CI ran it exactly once, on commit 649d5b8,
where it passed.
A hang only tells you that the test goroutine never got the value. R4 checks who did. It runs the
same body on a goroutine of its own, the way go test does, watches it from outside with a timer,
and adds two lines so the program records who received from done instead of guessing from the
silence:
R4 in full: the test's body, watched from outside
// R4: the timeout that could never fire.
//
// once runs the body of TestNoHangUnderContention as it stood before commit
// 0886ba7 on a goroutine of its own, as go test would, and watches it from
// outside with a timer that does work. Two lines are added: the workload
// records that it has sent its value, and the helper goroutine records that it
// was the one to receive it.
//
// Run: go mod init r4 && go get github.com/shaia/BloomFilter@c2a293b && go run .
package main

import (
	"fmt"
	"runtime"
	"sync"
	"sync/atomic"
	"time"

	bloomfilter "github.com/shaia/BloomFilter"
)

// once reports whether the test would have hung, and whether the helper
// goroutine took the value. headStart pauses after the helper starts; zero is
// the code as written. release sends a second value afterwards, so whichever
// goroutine lost can exit.
func once(headStart time.Duration, release bool) (hung, helperWon bool) {
	done := make(chan bool, 1)
	var sent, helperTook atomic.Bool
	returned := make(chan struct{})

	go func() { // the test goroutine
		defer close(returned)

		go func() {
			bf := bloomfilter.NewCacheOptimizedBloomFilter(1000, 0.01)

			const numGoroutines = 100
			var wg sync.WaitGroup

			for g := 0; g < numGoroutines; g++ {
				wg.Add(1)
				go func(id int) {
					defer wg.Done()
					for i := 0; i < 100; i++ {
						bf.AddUint64(uint64(i))
					}
				}(g)
			}

			wg.Wait()
			done <- true
			sent.Store(true) // added: the value is on its way
		}()

		// Wait for completion or timeout
		select {
		case <-done:
			// t.Log("SUCCESS: Retry mechanism completed without hanging")
		case <-func() chan bool {
			timeout := make(chan bool, 1)
			go func() {
				// 10 seconds should be more than enough for 10,000 insertions
				// If it takes longer, something is wrong
				select {
				case <-done:
					helperTook.Store(true) // added: the helper got the value
					return
				case <-make(chan struct{}):
					// Never triggered, just for type compatibility
				}
			}()
			time.Sleep(headStart)
			return timeout
		}():
			// t.Fatal("CRITICAL: Retry mechanism appears to have hung (timeout exceeded)")
		}
	}()

	hung = stuck(returned, &sent)
	helperWon = helperTook.Load()
	if release {
		done <- true
		<-returned
	}
	return hung, helperWon
}

// stuck reports whether the test goroutine is still waiting a full 100ms
// after the workload handed over its value.
func stuck(returned <-chan struct{}, sent *atomic.Bool) bool {
	sawSent := false
	for {
		select {
		case <-returned:
			return false
		case <-time.After(100 * time.Millisecond):
			if sawSent {
				return true
			}
			sawSent = sent.Load()
		}
	}
}

func tally(runs int, headStart time.Duration) (hangs, stolen int) {
	for i := 0; i < runs; i++ {
		hung, helper := once(headStart, true)
		if hung {
			hangs++
		}
		if helper {
			stolen++
		}
	}
	return hangs, stolen
}

func main() {
	fmt.Println("GOMAXPROCS", runtime.GOMAXPROCS(0))

	hangs, stolen := tally(10_000, 0)
	fmt.Printf("as written:          %d of 10000 runs hung; the helper took the value %d times\n", hangs, stolen)

	hangs, stolen = tally(20, time.Millisecond)
	fmt.Printf("1ms head start:      %d of 20 runs hung; the helper took the value %d times\n", hangs, stolen)

	time.Sleep(100 * time.Millisecond)
	before := runtime.NumGoroutine()
	for i := 0; i < 1000; i++ {
		once(0, false)
	}
	time.Sleep(100 * time.Millisecond)
	fmt.Printf("goroutines still parked after 1000 more runs: %d\n", runtime.NumGoroutine()-before)
}
$ go run .
GOMAXPROCS 32
as written:          10 of 10000 runs hung; the helper took the value 10 times
1ms head start:      20 of 20 runs hung; the helper took the value 20 times
goroutines still parked after 1000 more runs: 1000
That is the first of five runs on Windows, where the helper won 10, 6, 8, 7 and 5 times in 10,000,
and every one of those runs hung. On Linux the five runs gave 0, 0, 0, 1 and 1, and a run under
-race gave 0. With a one-millisecond head start the helper won all 20 runs on both systems, which
is the same mechanism with the luck taken out. And every run that passed left its helper behind:
1,000 runs, 1,000 goroutines still parked.
The rates are the unreliable part. R4 sees the helper win on Windows more often than the real test
ever hung there, and I haven’t untangled why. The scheduler’s timing depends on everything around
that select, including what the program’s other goroutines are doing. The shape doesn’t move:
every hang is the helper holding the value, and every pass leaks a goroutine.
The fixed test is still in the suite, and its comment says a slow run means “the retry mechanism has hung”. While only Adds write, that is the one thing the loop cannot do, so the test now watches for a failure the loop’s structure rules out. As a regression guard that’s fine. It just isn’t evidence about retries, and nothing else in the file is either: none of its four tests counts a failed CAS.
The takeaway
A retry limit is a decision about what should happen when a loop fails. Before making it, find out whether the loop can fail. Here, “can this CAS fail forever?” had an answer that fits in a paragraph, and the answer turned the question around. The loop was never what could break the promise. The writers that could were the ones that never used a CAS at all.
The general version: when you have made one writer correct, list every other writer to the same memory. The race detector will show you some of them. It will not show you the ones written in assembly, and in a library built around SIMD, those do most of the writing.
Corrections
- Part 1 calls unset bits “an acceptable trade-off in a bloom filter to prevent a livelock”. There was no livelock to prevent, the limit cannot be reached while only Adds write, and a Bloom filter has no acceptable false negatives. The loop it printed as final had already been replaced when the post was published.
- The benign-read post says the same loop “Correctly uses an atomic CAS loop”. The CAS was correct, and its limit was dead code. The “atomic-first design” it describes also left out three writers that use no atomics at all.
- Part 2 marks atomic operations “for all
reads/writes to
cacheLine.words” as complete.Union,IntersectionandClearwere never included. - The library’s README lists
Union,IntersectionandClearas thread-safe. Beside anAdd,UnionandIntersectionare not.
Each of those posts now carries a note that points here.
A note on the evidence
What I observed. Every reducer’s output on this page came from the listing printed with it, on
one machine: an Intel i9-13980HX (8 performance and 16 efficiency cores, 32 threads), Windows 11,
Go 1.25.5. The race-detector runs and the Linux runs are WSL2 Ubuntu on the same machine with the
same Go version; the race detector needs cgo, and my Windows toolchain has none. R3, R4 and R5 use
the library at commit c2a293b, and R1 and R2 copy the loop from 4b27e48. The hang and its
goroutine dump come from go test on the 0886ba7^ tree itself. Before publishing, I extracted
every listing back out of this page and ran those copies. R1, which is deterministic, printed exactly
what is shown here. The others depend on timing, and came back with different numbers and the same
shape. An earlier version of R4 started the workload from outside the test goroutine, and its rates
were of the same order. Other work was running on the machine at the same time; CPU load sampled at
the start of each step read between 0 and 54%.
What I read rather than ran. That Go’s CAS cannot fail spuriously comes from the go1.25.5 runtime
source for amd64 and arm64; nothing here ran on arm64. That the runtime won’t preempt assembly comes
from runtime/preempt.go. That the kernels haven’t changed since 4b27e48 comes from their git blob
hashes. The disassembly is go tool objdump on a binary linked against the 4b27e48 tree.
What I inferred. I found no documentation saying the race detector can’t see assembly. I inferred
it from where Go’s race instrumentation happens, in the compiler, which never sees .s files,
together with R3’s silent run. How the helper goroutine gets ahead of the test goroutine is reasoned
from the language spec and the scheduler, not traced. What the runs show is that it happens, and the
head start in R4 shows that ordering is what decides it. The exhaustive search covers 8 bits, not
64, and the counting argument covers the rest. The Clear adversary in R1 is one I wrote; R2 never
saw a call fail more than six times.
What I couldn’t recover. CI ran the broken test exactly once, on commit 649d5b8, with
go test -race -short under Go 1.23 on Ubuntu, and the job passed in 37 seconds. Its logs have
expired (GitHub answers HTTP 410), so the pass is all it can tell me.
What I would still change. The library, which this post doesn’t touch. Union and
Intersection need either a documented contract (not safe beside Add) or kernels that don’t store
stale words back. The README’s “thread-safe” needs to go. And bloomfilter_retry_test.go needs a test
that counts retries, or a different name.