Your profiler said dispatch. It did not say virtual.
 Your profiler said dispatch. It did not say virtual.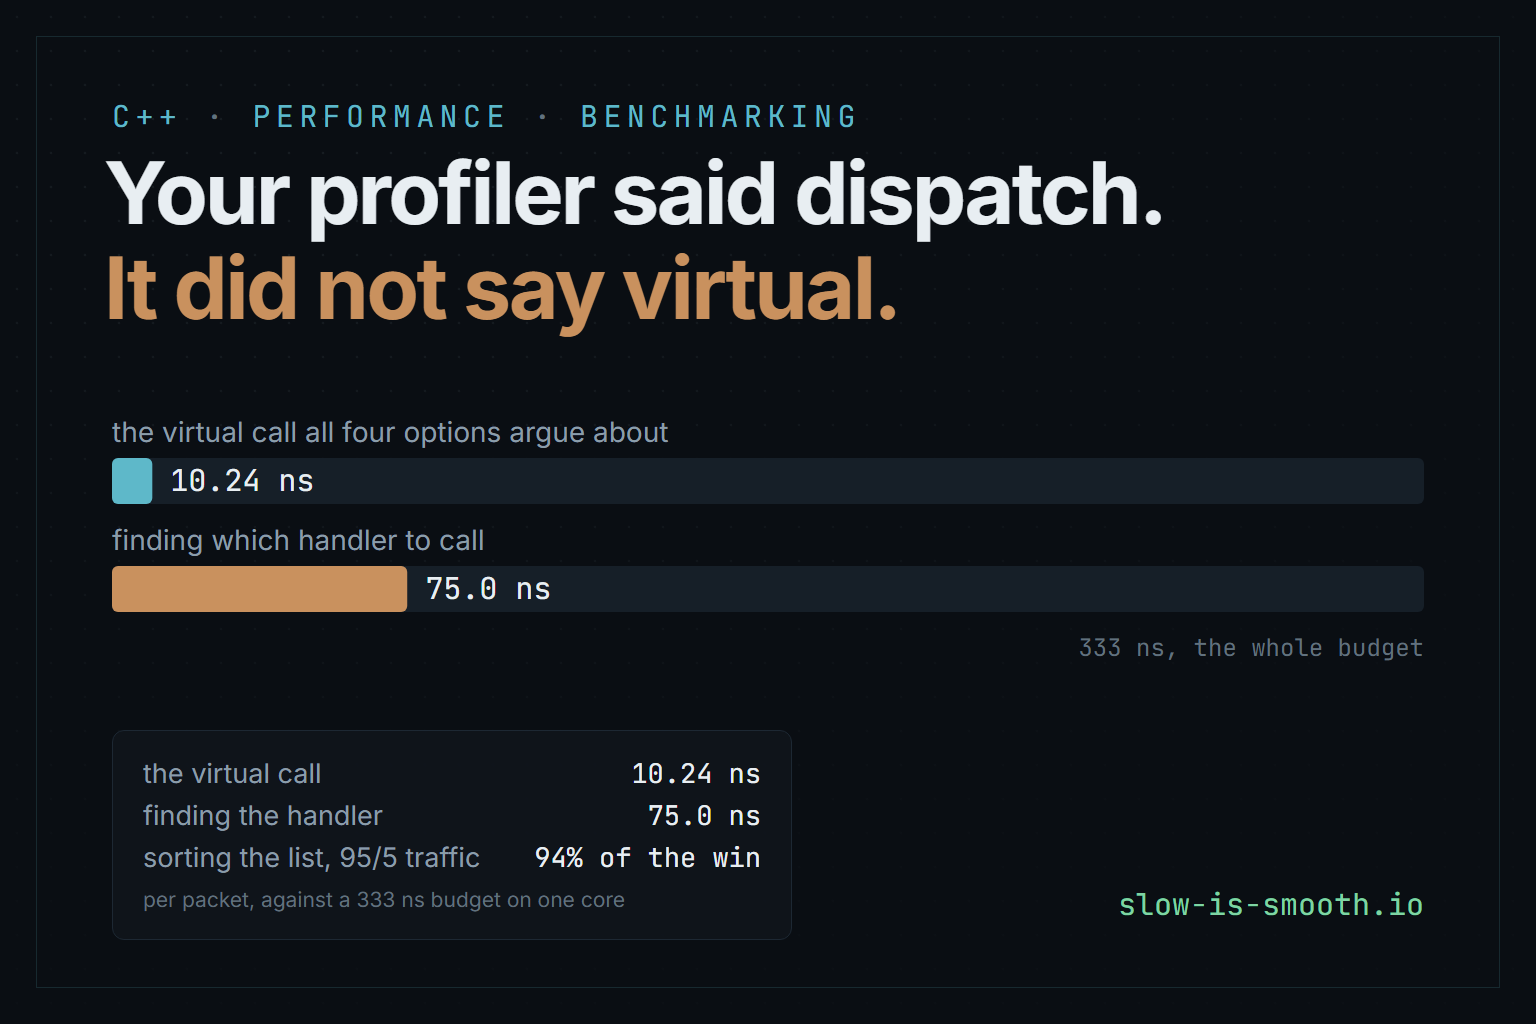
Contents
A profile says dispatch is getting expensive at several million packets a second, and all four
fixes the team proposes make the virtual call inside it cheaper. Measured, that call costs about
10 nanoseconds of a 333-nanosecond budget, and the fastest alternative saves 1.7 of them. Finding
which of a hundred handlers to call costs 75. None of the four proposals touches it.
A packet-processing service, 100 protocol handlers, a plugin ABI, and what happens when you measure the thing the question told you not to look at.
This is a guided walkthrough of the C++ answer to the plugin-dispatch kata, one of the design exercises I keep in principal-katas. The solution document is written as an answer — dense and argued, assuming you already worked the problem. This one is written to be learned from. It derives the numbers instead of quoting them, stops to explain the background it depends on, and asks you to predict results before showing them. You do not need the kata to follow it: the brief is restated in full below.
Every number comes from running the kata’s benchmark, and every figure on this
page is drawn from the same recorded numbers that its
make_figures.py keeps, so the prose and the pictures cannot
drift apart.
How to read this. Wherever you see a Predict box, actually stop and answer it. The post is built around a sequence of results that are not what most people guess, and the value is in noticing the gap between your guess and the measurement. Three of my own predictions turned out wrong, and they are all still in here with the evidence that changed my mind.
What you need to know already: C++ basics and roughly what a virtual function is. Everything
else — vtables, instruction cache, ABIs, dlopen, identical-code folding — is explained where it
first matters.
1. The question, and the trap inside it
You are designing a C++20 packet-processing service. Packets arrive; each belongs to some protocol; a handler knows how to process one protocol. New protocols get added over time, and some handlers ship as plugins rather than being compiled into the service.
Here is the code, and it is the most natural thing anyone would write:
struct Handler {
    virtual ~Handler() = default;
    virtual bool   matches(const Packet&) const = 0;   // "is this mine?"
    virtual Result process(const Packet&)       = 0;   // "then here's the answer"
};

std::vector<std::unique_ptr<Handler>> handlers;

Result dispatch(const Packet& p) {
    for (auto& h : handlers) {
        if (h->matches(p))
            return h->process(p);
    }
    return Result::unsupported();
}
A concrete pair of handlers, so the shape is clear:
struct TcpHandler : Handler {
    bool matches(const Packet& p) const override { return p.protocol == 6; }
    Result process(const Packet& p) override { /* ... */ }
};

struct UdpHandler : Handler {
    bool matches(const Packet& p) const override { return p.protocol == 17; }
    Result process(const Packet& p) override { /* ... */ }
};
The brief adds three facts:
- There may be 50–100 handlers.
- Some are built in; others come from separately compiled shared libraries.
- Profiling shows
dispatchis becoming expensive at several million packets/sec.
And the team proposes four alternatives:
- Keep virtual interfaces
std::variant+std::visit- Templates / static polymorphism
- Custom type erasure
Predict. Before reading on: which would you pick, and what would you expect the speedup to be? Write it down. Most people pick 2 or 4 and expect something like 2×.
The trap
Read the option list one more time, and ask what all four have in common.
Every one of them changes how process is called. Not one of them changes how many times
matches is called.
Now look at what the profiler actually said: dispatch is expensive. That is a statement about a
function. The option list is a proposal about a line inside it — specifically, the
h->process(p) line. Between those two statements sits an assumption nobody tested.
  what the profiler measured        what the option list assumes
  --------------------------        ----------------------------
  dispatch()  ......... hot         the virtual call in it is slow
     |
     +-- for (auto& h : handlers)   <-- nobody looked here
     +-- h->matches(p)              <-- or here
     +-- h->process(p)              <-- all four options fix THIS
This matters far beyond this kata. A sampling profiler attributes samples to functions. Getting from “this function is hot” to “this operation is slow” is a separate inference, and it is where an enormous amount of optimization effort is wasted.
Everything below is what happens when you check.
2. First, work out what you can afford
Never optimize without a budget. Otherwise you cannot tell a real win from a rounding error.
The brief says “several million packets per second”. Take three million, on one core:
1 second / 3,000,000 packets = 333 nanoseconds per packet
That 333 ns has to cover everything: parsing, selecting the handler, the handler’s own work, and producing a result. On a ~3 GHz core that is roughly a thousand cycles.
A thousand cycles sounds generous. Here is what it actually buys, so you can calibrate:
| operation | typical cost | how many fit in 333 ns |
|---|---|---|
| L1 cache hit | ~1 ns | 300 |
| correctly predicted branch | ~0.3 ns | 1000 |
| mispredicted branch | ~5 ns | 65 |
| L2 hit | ~4 ns | 80 |
| L3 hit | ~20 ns | 16 |
| DRAM access | ~80 ns | 4 |
(Orders of magnitude for a modern x86 core, not measured here — they are for calibration only. Every other number in this post is measured, or says how it was computed.)
Look at the mispredicted-branch row and hold onto it. Sixty-five mispredictions consume the entire budget. The brief says there are 50–100 handlers, and the loop makes a data-dependent branch decision per handler. That should already be making you uneasy about the loop rather than the call.
From here on, every cost is reported against 333 ns, because a number you cannot compare to a budget is trivia, not a measurement.
3. Cost the loop before you cost the call
First, predict it
Before running anything, you can work out what the loop should cost. This is worth doing by hand, because if the measurement disagrees with a careful estimate, one of them is wrong and you want to know which.
Setup: 100 handlers, traffic spread uniformly across them, and about 2 % of packets match no handler at all (a real service always has some).
How many matches() calls per packet?
  matched packet:    handler is equally likely to be at any position 1..100
                     average probes = (1 + 100) / 2 = 50.5

  unmatched packet:  every handler is asked, and all say no
                     probes = 100

  weighted:          0.98 x 50.5  +  0.02 x 100
                   =    49.5      +    2.0
                   =   51.5 probes per packet
Predict. The measured value is 52.3. Where does the extra 0.8 come from?
Answer
From the handlers whose predicate is not just a key comparison. In the benchmark, 10 % of handlers also test a payload byte, and they share three protocol keys among them. A packet carrying one of those keys has to walk past the handlers whose extra condition fails before reaching the one that matches, and every one of them is eighth in its ten: key 901’s four sit at positions 8, 38, 68 and 98, averaging 53 rather than 50.5. Keys 900 and 902 have only three handlers for four payload values, so one packet in four carrying them matches nobody and walks all 100.
Redo the arithmetic with that split, enumerating every handler and payload value, and you get 52.2 against a measured 52.3. That is close enough to say you understand the system.
Now measure it
What the loop costs as handlers are added
Uniform traffic, the brief's loop against a key-indexed table that runs the very same handlers. Nanoseconds per packet, measured.
Before you look: at 100 handlers, how many nanoseconds of every packet go to finding the handler?
Measured, uniform traffic, handlers of 1,800 bytes each. The table's line is not flat either: selection is one index at every count, but a hundred handler bodies no longer fit in the instruction cache.
At 100 handlers the loop runs 52.3 matches() calls per packet, and the whole arm costs
142.8 ns — 43 % of the entire budget. The table arm runs the very same handler bodies for
67.8 ns, so about 75 ns of that is spent finding the handler before it does one byte of useful
work.
Here is what those probes look like, next to the alternative:
One packet, a hundred handlers
Each square is a handler, in registration order, left to right and top to bottom.
Send a packet and count the matches() calls on each side before anything runs.
Press Next packet to send one.
The brief's loop: ask each handler in turn
matches() calls: 0
The table: index by the packet's key
matches() calls: 0
Simulated with the benchmark's own handler set and traffic: uniform over 100 handlers, 2% of packets carrying a protocol nobody claims. Under that model the loop averages 52.2 calls, and the benchmark counted 52.3. Measured at 100 handlers, the loop arm costs 142.8 ns a packet and the table arm 67.8 ns. Both run the same handler bodies, so the 75 ns between them is the search.
Read the shape, not just the endpoint
Two things in that chart are worth more than the headline number.
The loop’s line tracks probes, not handlers-as-such. Double the probes, roughly double the cost.
That is the signature of a search, and no change to how process is called can touch it.
The table’s line is not flat. The table’s selection is O(1) — one array index, regardless of handler count — yet it still climbs from 36.2 ns to 67.8 ns as handlers go 10 → 100.
Predict. Why would an O(1) lookup get slower as you add handlers it never looks at?
Answer
Because selection is O(1) but the code being selected is not free to have around. 100 handler bodies are 176 KiB of machine code, and the CPU’s instruction cache holds 32 KiB. The lookup did not get slower; fetching the handler’s code did.
This is §6, and it turns out to cost more than the entire polymorphism debate.
The arithmetic that decides the kata
  cost of finding the handler at 100 handlers   ~ 142.8 - 67.8  =  75 ns
  cost of the dispatch mechanism (measured §5)                  =  10 ns
You are being invited to argue about the 10 while the 75 sits untouched. That is the whole trap, and you can see it before writing a line of the replacement.
Transferable lesson: when a profiler blames a function that contains a loop, cost the loop first. “How expensive is this operation” and “how many times do we do it” are different questions, and the second one is usually where the order of magnitude lives.
4. Stop searching
A linear search is made fast by not performing one. The packet already carries a protocol number; use it as an index.
// The idea, in its simplest form.
std::array<Handler*, 65536> table;      // indexed by p.protocol
Handler* h = table[p.protocol];
return h ? h->process(p) : Result::unsupported();
That much is obvious and most people get there quickly. The two things that are not obvious are what it costs you — and neither cost is measured in nanoseconds.
Problem 1: not every predicate has a key
matches() is arbitrary code. Nothing in the brief says it only compares a protocol number, and in a
real system it often does not:
// Fine — a pure function of the key. Can own a table slot.
bool matches(const Packet& p) const override { return p.protocol == 6; }

// NOT a function of the key. No table can select on this.
bool matches(const Packet& p) const override {
    return p.protocol == 6 && p.payload[0] >= 0x40 && p.payload[0] < 0xC0;
}

// Worse — depends on state from earlier packets.
bool matches(const Packet& p) const override {
    return p.protocol == 6 && session_table_.has_active(p.flow_id());
}
Call the extra clause a residual predicate: the part of matches() left over after you factor
out the key. A handler with one cannot own a slot outright, because owning a slot means “if the key
matches, you run” — and that is not true of it.
So the design is not “table instead of loop”. It is table, then a very short loop:
The lookup, in the order the code runs it
For most packets: one masked index and one comparison. The short loop exists only for handlers whose predicate tests more than the key.
The green path is the whole win: the key has already proved which handler this is, so
matches() never runs. In the benchmark 90 of the 100 handlers own a slot outright.
The other 10 also test a payload byte and share three keys, so their candidate lists are 3, 4
and 3 long.
Each slot is one of two shapes:
struct Slot {
    uint16_t      key;     // the protocol that claimed this slot, verified on lookup
    Handler*      only;    // fast path: this handler's predicate IS "key matches",
                           //   so once the key selected it, no test is needed at all
    uint32_t      begin;   // slow path: a range into a flat array of candidates,
    uint16_t      count;   //   which must still be scanned with matches()
};
And the lookup, in full — this is the real code:
const Slot& s = tbl_[p.protocol & kMask];
if (s.key != p.protocol) return Result::unsupported();   // key not claimed
if (s.only) return s.only->process(p);                   // fast path: no matches() at all
for (uint16_t i = 0; i < s.count; ++i) {                 // slow path: short scan
    Handler* h = cand_[s.begin + i];
    if (h->matches(p)) return h->process(p);
}
return Result::unsupported();
Notice what the fast path does not do: it never calls matches(). That is where the win comes
from. The key already proved the handler is the right one, so the test is redundant — and deleting
redundant work is a much better trick than making the work faster.
The residual list is where the complexity you removed goes to live. Bounding it is a design constraint the brief never mentions and you have to invent. If most of your handlers end up in residual lists, you have rebuilt the loop inside the table and paid for a schema on the way.
In the benchmark, 10 % of handlers are given a residual predicate and made to share keys, so those lists are genuinely 3–4 entries long. That is deliberate: a version where every list had one entry would have made the table look better than it deserves.
Problem 2: first-match-wins is a behaviour, and a table has no order
The brief’s loop returns the first match. If two handlers’ predicates overlap, the list’s order decides which one runs — which means the order is observable behaviour, and somebody may be relying on it.
The benchmark asserts this rather than describing it:
overlapping predicates: registration order -> handler 1, reversed -> handler 2
Same two handlers, same packet, different answer — because the list was in a different order.
Why this matters more than it looks: §10’s cheapest competitor to the entire rewrite is sorting the handler list. If any two predicates overlap, that one-line “optimization” silently changes what your service does. Hold that thought.
Problem 3: the table you index directly is a megabyte
The protocol field is 16 bits, so the naive table has 65536 slots whether you use them or not:
  direct16   [ 65536 slots x 16 B ]  = 1024 KiB, of which 100 slots are used
  compact    [  1024 slots x 24 B ]  =   24 KiB, key stored and verified in the slot
Measured speed difference: inside the noise (66.8 vs 68.5 ns), because the handful of hot slots stay cached either way.
So does it matter? Yes — and the benchmark cannot show you why. A megabyte of L2 and L3 spent on mostly-empty pointers is a cost paid by every other part of the process, and a benchmark that measures only this loop will never see it. This is a general hazard: a microbenchmark cannot measure the cost your code imposes on its neighbours.
The compact table stores the key in the slot and verifies it, which costs one comparison and turns a 1 MiB array into 24 KiB. Take that trade.
Try it yourself. Why not
std::unordered_map<uint16_t, Handler*>?Answer
A hash map costs you a hash, a modulo, a bucket load, and a pointer chase into a node — and gives back the ability to have a sparse, arbitrary key space you did not need, since the key is already a small integer.
p.protocol & kMaskis one AND. Reach for a hash map when the key is a string or genuinely sparse; here the key was designed to be an index.
5. Only now, the mechanism
Selection is O(1). One call per packet remains. Now the brief’s question can be asked, and asked against the right number.
What a virtual call actually does
Worth being concrete, since the whole debate is about these few instructions:
  h->process(p)   with h a Handler*

  1. load the object's vtable pointer     mov  rax, [rdi]        <- depends on h
  2. load process's slot from the vtable  mov  rax, [rax + 16]   <- depends on step 1
  3. indirect call                        call rax               <- depends on step 2
Three steps, each depending on the previous one — a dependency chain the CPU cannot overlap. Plus the indirect call is a branch whose target the predictor must guess; with 100 possible targets it often guesses wrong, and §2’s table says a mispredict is ~5 ns.
Type erasure removes step 1 by storing the function pointer next to the object pointer:
struct Erased {
    void*  obj;                              // the handler's state
    Result (*fn)(void*, const Packet&);      // the handler's code
};
// dispatch: const Erased& e = table[i]; return e.fn(e.obj, p);
  virtual   table[i] -> Handler*  ->  vtable*  ->  fn      (two dependent loads)
  erasure   table[i] -> { obj, fn }            ->  fn      (one)
Predict. How much is that one saved load worth, per packet?
The measurement
All four arms below perform the identical selection — one masked array index — and differ only in
how they reach process(). Selection is common-mode and cancels out, which is the only way a
comparison of dispatch mechanisms means anything.
What the four options compete over, and what costs three times more
Every arm makes the identical selection, one masked index, and differs only in
how it reaches process(). Nanoseconds per packet, measured.
One handler resident, or a hundred interleaved
the number above each copper column is mixed minus hot
The dispatch mechanism alone
tiny handlers, minus direct-call's 0.91 ns floor
process()Left: direct-call is the control. It always runs the same handler body, so it has no instruction-cache cost to pay, and its +0.10 ns is what an honest zero looks like. Right: the mechanism costs 8.6 to 11.0 ns, about 3% of the 333 ns budget, and the choice between the three is worth 1.7 ns. Interleaving a hundred handlers costs three times the mechanism, most of it in the instruction cache.
The second panel answers the question as asked:
| mechanism | cost | share of the 333 ns budget |
|---|---|---|
| erasure | 8.57 ns | 2.6 % |
| virtual | 10.24 ns | 3.1 % |
| variant | 10.98 ns | 3.3 % |
The entire debate is worth 1.7 ns, and the whole mechanism is worth about 3 % of a packet. Type erasure does win, and the reason is exactly the saved dependent load — but if you cannot name the cost you removed, you are cargo-culting.
Compare that against §3: the search was 75 ns. You were invited to optimize the 10 and ignore the 75.
std::variant is disqualified by a sentence, not a benchmark
This is the part worth internalizing, because it is a kind of reasoning rather than a fact.
Go back to the brief: “others come from separately compiled shared libraries.”
Now consider what std::variant is:
using AnyHandler = std::variant<TcpHandler, UdpHandler, IcmpHandler /*, ... */>;
Every alternative must be named at compile time. That is what makes std::visit fast — the compiler
knows the complete set and can build a jump table.
But a plugin’s type does not exist when you compile the host. There is no name to write. You cannot add an alternative at runtime; the set is closed by construction.
// There is no syntax that makes this work, and that is not an oversight:
AnyHandler h = load_plugin("acme_protocol.dll");   // <- type unknown at compile time
That is the entire verdict, and it is a stronger argument than any benchmark, because a benchmark result can be overturned by a faster machine or a better compiler and this cannot. The requirement and the mechanism are incompatible.
The benchmark measures variant anyway — it comes last, at 10.98 ns — but note that “also slower” and “cannot express the requirement” are different claims, and only one of them is decisive. Reaching for the benchmark first was the mistake.
Templates fail the same way for the same reason: they monomorphize beautifully for handlers the compiler can see, and the compiler cannot see a plugin. Templates survive for built-ins only — which is the two-plane split of §7 arriving whether you invited it or not.
The general lesson: before benchmarking a set of options, check which of them the requirements already eliminate. Constraints are cheaper to evaluate than performance, and they are not negotiable later.
6. The thing that costs three times more than the mechanism
Now the first panel of that figure, which is where the real finding is.
Background: the instruction cache
Your CPU caches code the same way it caches data, in a separate structure called L1i, typically 32 KiB. Code that is not in L1i must be fetched from L2, L3 or memory before it can execute, and the CPU’s front end stalls while that happens.
Handler code is code. 100 handlers of 1800 bytes each:
  L1i          |################|                                    32 KiB
  handler set  |####################################################...
               |                                                    176 KiB

  176 / 32  =  5.5x oversubscribed
At any moment, at most about 18 of your 100 handlers can be resident.
The experiment
Two arms, differing only in the traffic they are sent:
- hot — every packet goes to the same handler. Its code stays in L1i; the indirect call always has the same target, so the branch predictor is always right.
- mixed — skewed, Zipf-shaped traffic across all 100 handlers.
Same selection. Same mechanism. Same handler bodies. Only the access pattern differs.
One handler resident, or a hundred taking turns
The same dispatch code on both sides, the same selection, the same handler bodies. Only the traffic differs, and with it how often the code the call needs is not where the CPU looks first.
hot: one protocol
every packet reaches handler 0
packets 0 · refetched 0
measured: 27.57 ns a packet
mixed: Zipf traffic over all 100
the cartoon cache keeps the last 18 bodies
packets 0 · refetched 0
measured: 61.26 ns a packet
Measured on the virtual arm: a hundred handlers taking turns cost 33.69 ns a packet more than one resident handler, while the direct-call control moves 0.10 ns. About 9 ns of that gap is the call's target becoming unpredictable, which this cartoon does not draw: shrink every handler until the set nearly fits in the cache and the gap falls to 9.0 ns. The rest is fetching code. The cache above is a strict least-recently-used set of 18 whole bodies, 32 KiB over 1,800 bytes each. A real L1i caches instruction bytes, not functions, and a miss falls through to L2 rather than to nothing. Its refetch counts are simulation. The nanoseconds are not.
| mechanism | hot | mixed | difference |
|---|---|---|---|
| virtual | 27.57 ns | 61.26 ns | +33.69 |
| erasure | 27.38 ns | 60.41 ns | +33.03 |
| variant | 27.72 ns | 64.54 ns | +36.82 |
| direct-call (control) | 26.26 ns | 26.36 ns | +0.10 |
33 to 37 ns per packet — three times what the dispatch mechanism itself costs, and some twenty times what choosing between virtual, variant and type erasure is worth. It is 10 % of the entire budget, and it is invisible to any benchmark that uses one handler.
Be precise about what that column holds, though, because two things change between the arms, not
one. The front end has to fetch code that is not in L1i, and the indirect call’s target stops being
predictable. §5’s mechanism figure already pays for the second, since its tiny handlers see the same
mixed traffic. Taking it out by subtraction, and assuming the two costs simply add: on virtual,
predicted dispatch costs 1.3 ns (27.57 against direct-call’s 26.26) and dispatch under mixed
traffic 10.2 ns, so about 9 ns of the 33.7 is the mispredicted target and about 25 ns is fetching
code. The instruction cache on its own is still two and a half times the whole mechanism.
I checked that split afterwards with a second build in which every handler is the tiny size, so the
whole set is 33 KiB instead of 176 and nearly fits in L1i. The hot-to-mixed gap fell to 9.0 ns on
virtual, 7.2 on erasure and 9.4 on variant, within a quarter of a nanosecond of the
subtraction, with the control at −0.03.
The control is what makes this trustworthy
Look at direct-call: +0.10 ns.
That arm always calls the same handler, so by construction it has no instruction-cache cost to pay. It should read zero, and it does.
That single row is what turns the other three from assertions into measurements. Without it, 33 ns could have been thermal drift, a scheduler hiccup, or an artifact of how the two arms were ordered. With it, you know the column measures what it claims.
A benchmark without a control that should read zero is a benchmark you cannot trust when it reads non-zero. This is the single most reusable idea in this post.
What this means for how you benchmark dispatch
A one-handler microbenchmark — the kind almost every blog post about virtual-vs-variant uses — ranks the four mechanisms within 1.5 ns of each other (26.26 to 27.72). The effect it cannot see is twenty times larger than the effect it reports. Finding Errors in Log Streams ran into the same thing with a different data structure: one position queried over and over read 2.56 ns, and scattered positions 16.6 ns. A microbenchmark that hammers one input measures your cache, not your algorithm.
So: build the interleaved benchmark, or do not benchmark dispatch at all.
7. Two planes
Here is where the answer stops being about polymorphism.
Write down what each side actually needs:
| The plugin boundary needs | The hot path needs |
|---|---|
| stability across compilers you will never see | everything visible to the optimizer at once |
| loose coupling, opaque handles | concrete types |
| C-compatible, POD, fixed layout | templates and variants permissible |
| a small surface, because the compatibility matrix multiplies | as large as it needs to be |
These columns have no row in common. Every property that helps one hurts the other. A single mechanism satisfying both satisfies neither well.
So the answer is:
I would not require the same abstraction mechanism at the ABI boundary and on the hot path.
That sentence is the whole senior-to-principal move, and notice its shape: it is a refusal. The question offers four mechanisms and asks you to pick one. The strongest answer declines the framing and explains why the framing was wrong.
Two planes, and the one thing that crosses between them
A plugin reaches the hot path only as a C struct of function pointers. A host-side adapter turns that into an ordinary C++ handler, and the table cannot tell the difference.
Nothing obliges the two planes to share a mechanism, and every property that helps one hurts the other. So the boundary is plain C, the hot path is ordinary C++, and the plugin's types never enter the host's type system.
The adapter is about thirty lines and is the whole design in miniature: a C struct of function pointers goes in, an ordinary C++ object the optimizer understands comes out, and the plugin’s types never enter the host’s type system.
The constraint nobody sees coming
Here is a design consequence that only appears once you try to build it.
The host builds its dispatch table before traffic arrives. So it cannot learn which keys a plugin handles by calling its predicate on packets — there are no packets yet, and the table has to exist before the first one.
Therefore the plugin cannot merely demonstrate what it handles. It must declare it:
uint16_t (*claimed_keys)(uint16_t* out, uint16_t cap);
Registration happens before the first packet
The host builds its table before traffic arrives, so a plugin cannot show what it handles. It has to declare it.
The host checks abi_version before it trusts struct_size, because a size
cannot say that an existing function now means something else. It asks for the key count with a null
buffer and then asks again with room for the answer: across this boundary the caller owns all memory.
And the object create() hands back goes to destroy() on the same side that
allocated it.
(Note the two-call idiom on claimed_keys: ask for the count with a null buffer, allocate, then ask
again. That is how you pass a variable-length list across a boundary where the caller owns all
memory.)
And “what it handles” has to be expressible in the boundary’s vocabulary — which is two integers in a C struct, not arbitrary C++.
This propagates backwards into §4. A plugin’s predicate can be a key, or a key plus something the host cannot see; and the second kind can only ever land in the residual list. The two planes are not independent: the boundary’s poverty is what shapes the table.
8. The ABI, in bytes
typedef struct SwyPluginApi {
    uint32_t struct_size;    /* extension mechanism 1 */
    uint32_t abi_version;    /* extension mechanism 2 */
    uint16_t (*claimed_keys)(uint16_t* out, uint16_t cap);
    void*    (*create)(void);
    void     (*destroy)(void* self);
    int32_t  (*process)(void* self, const SwyPacketView* pkt, SwyResult* out);
#if SWY_PLUGIN_ABI_LEVEL >= 2
    int32_t  (*process_batch)(void*, const SwyPacketView*, size_t, SwyResult*);
#endif
} SwyPluginApi;
The test to apply to every field
Could this be produced by a different compiler, a different standard library, or a different language, three years from now?
Anything that fails is not part of your ABI — it is part of your API, and it has no business crossing
a dlopen.
Here is the version somebody writes first, and every line of it is a bug:
struct BadPluginApi {
    std::string     name;          // layout differs across libstdc++ versions AND flags
    std::vector<uint16_t> keys;    // no guaranteed layout at all
    bool            enabled;       // sizeof(bool) is implementation-defined
    size_t          version;       // 4 bytes or 8, depending on the target
    enum Level      level;         // underlying type is the compiler's choice
    std::shared_ptr<Handler> h;    // control block is an implementation detail
};
None of those fails at link time. It compiles, it loads, it runs, and then it does something wrong at an unpredictable later moment. That is the whole reason the boundary is C.
The rules that fall out: fixed-width integers only, no bool in a crossing struct, no size_t in a
stored field, no enum without an explicit representation, and every buffer a pointer plus an explicit
length.
Two extension mechanisms, and they compose
You will need to add a function to this interface some day, without breaking every plugin already deployed. Two mechanisms do it, and they cover different cases.
  plugin_v1 (built against the older header)     struct_size = 40
  +--------+--------+--------+--------+--------+
  | size   | abiver | keys   | create | destroy|  ... process
  +--------+--------+--------+--------+--------+
                                                ^ ends here. process_batch is
                                                  ABSENT, not merely unset.

  plugin_v2                                      struct_size = 48
  +--------+--------+--------+--------+--------+--------+
  | size   | abiver | keys   | create | destroy| process| process_batch
  +--------+--------+--------+--------+--------+--------+
struct_sizehandles appending. A new host reads it and discovers how much of the struct an old plugin actually has.abi_versiongates whatstruct_sizecannot express: removing a function, or changing what an existing one means. Nothing about a size tells you thatprocessnow expects host-byte-order.
struct_size must be present in version 1 or it can never be added — because adding it later
requires reading a field to know whether the field exists. That is the one genuinely irreversible
decision in the file.
The host’s check is arithmetic:
bool has_batch() const {
    return api_->struct_size >= offsetof(SwyPluginApi, process_batch) + sizeof(void*);
}
And this is demonstrated, not asserted: plugin_v1 is genuinely compiled against a shorter header,
so the field does not exist in its build. One host drives both:
  plugin_v2      loaded    struct_size  48  abi 1  keys 4  batch yes
  plugin_v1      loaded    struct_size  40  abi 1  keys 4  batch no
Surprise: batching the crossing recovers nothing
Predict. A plugin call crosses a
dlopen’d boundary. How much does that cost per packet, and how much would batching 64 packets per call recover?
  path                   |    ns/pkt vs internal
  internal virtual call  |       7.1           -
  plugin, per packet     |      10.1       +3.0
  plugin, batched x64    |      10.2       +3.1
The crossing costs 3.0 ns — 1 % of the budget — and batching recovers nothing.
I expected otherwise, and the reason I was wrong is worth understanding. An in-process C ABI crossing is an indirect call through a function pointer plus a struct copy. There is no transition to amortize: no context switch, no serialization, no ring buffer, no kernel. Meanwhile the batch loop has to write 64 view structs and read 64 results, and that memory traffic costs about what the saved call did.
Batching is the right answer where a crossing has a real fixed cost — a cgo call, an IPC round trip, a syscall. Designing it into this ABI on the assumption that “boundaries are expensive” would have been complexity bought against a cost that was not there.
This is a good example of a general trap: an intuition calibrated on one kind of boundary transferred to a different kind. The word “boundary” was doing work my reasoning had not checked.
9. Four silent failures the C boundary removes
The real argument for extern "C" is not “C is portable”. It is that one decision makes four
specific, silent failure modes impossible rather than merely unlikely.
1. The two heaps
   host binary                          plugin.dll
  +--------------------+               +--------------------+
  | operator new  ---> | heap A        | operator new  ---> | heap B
  | operator delete    |               | operator delete    |
  +--------------------+               +--------------------+
            \                                    /
             \___ a pointer allocated in B  ____/
                  and freed in A is a corruption
                  whose crash arrives later, elsewhere,
                  in unrelated code
Code that looks completely reasonable:
Handler* h = plugin_create();   // allocated by the plugin's operator new
// ... later ...
delete h;                       // freed by the HOST's operator delete
If the plugin links the C++ runtime statically — an entirely ordinary way to ship one — those are different allocators with different heaps, and this corrupts one of them.
Hence the ABI pairs create with destroy: whoever allocated it, frees it. Not symmetry for its
own sake; arithmetic.
The probe measures it. On this machine both resolve to the same shared libstdc++, so there is one heap — here. The ABI is designed so the answer never depends on which situation you happen to be in.
2. ODR, which discipline cannot defend against
The One Definition Rule says a symbol has one definition. Inline functions and template instantiations appear in every translation unit that uses them, so the linker and loader are allowed to pick one and discard the rest.
Now: both binaries contain std::vector<int>::push_back, compiled with different optimization flags
and possibly different standard-library versions. The loader picks one. One binary is now calling a
function it was not compiled against, and no diagnostic exists anywhere in the toolchain.
You cannot defend against this by being careful, because it is not something you do. Hidden
visibility (-fvisibility=hidden, exactly one exported symbol) removes the opportunity.
3. Exceptions are a protocol, not a value
An exception is not a return value that happens to travel differently. It is a stack-unwinding protocol requiring unwind tables, a personality routine, and a runtime that both sides share. Two binaries that do not share one do not share exceptions, and the failure is not a compile error.
So every entry point is noexcept and catches:
int32_t process(void* self, const SwyPacketView* pkt, SwyResult* out) noexcept {
    try { /* ... */ return SWY_OK; }
    catch (...) { return SWY_ERROR; }
}
Why both? noexcept alone calls std::terminate — correct, and fatal to your service. The
catch (...) converts the fault into the return value the ABI already has.
But state the containment claim narrowly: this shim contains unwinding, not damage. It cannot make a plugin that corrupted your heap safe to keep running. Knowing the difference is what separates a real containment story from a comforting one.
4. And the one that turned out to be folklore
Here is a claim I asserted, wrote a probe to demonstrate, and had refuted.
The folklore: a class built into a shared object with hidden visibility and loaded RTLD_LOCAL
gets a second, distinct type identity, so dynamic_cast across the boundary silently returns null.
(Background: RTLD_LOCAL is a dlopen flag meaning “do not make this library’s symbols visible to
anything else” — the correct default for a plugin. dynamic_cast works by comparing type_info
objects, one per class per binary.)
I built exactly that setup. The probe failed, because the cast worked:
  RTLD_LOCAL   cast ok    typeid== true   type_info @ host 0x5600af4cad60 / plugin 0x7f848ded4de8 (DISTINCT)
  RTLD_GLOBAL  cast ok    typeid== true   type_info @ host 0x5600af4cad60 / plugin 0x7f848ded4de8 (DISTINCT)
  note  __GXX_MERGED_TYPEINFO_NAMES = 0
Read those addresses. Half the folklore is exactly right: the two binaries genuinely hold two
distinct type_info objects. The mechanism is real.
The conclusion is still false, because of a detail nobody mentions. type_info::operator== does not
have to compare addresses. This libstdc++ is built with __GXX_MERGED_TYPEINFO_NAMES = 0, which
makes it fall back to strcmp on the mangled type name. Two distinct objects, same name, compares
equal, cast succeeds. The implementation defends against precisely this hazard. Adding
-Wl,-Bsymbolic does not change it either.
So the failure is a toolchain configuration away, not a certainty. On an implementation that
compares type_info by address alone, this identical code returns null.
The engineering conclusion survives — do not put RTTI in a plugin contract, because its correctness depends on a build-time constant of a standard library you did not choose — but the reason is different from the one usually given. Being precise about which is the difference between knowing this and having read about it.
The contrast: a failure that is loud
Not every ABI mismatch is silent, and it is worth seeing one that behaves:
undefined reference to `consume(std::string const&)'
Two translation units disagreeing about _GLIBCXX_USE_CXX11_ABI mangle std::string differently, so
the symbol simply is not there. That is the good case — the mismatch is caught at link time.
Reach the same disagreement through a dlopen and there is no link step to catch it.
10. Does any of it actually pay?
This is the section that can kill everything above it, and it is written to be able to.
The number the brief withheld
Go back and reread the brief. It tells you there are 50–100 handlers. It never tells you how traffic is distributed across them — and that is the number that decides whether the rewrite was worth building.
Here is why. A linear scan over a list ordered by frequency costs about as many probes as the traffic is skewed:
  if 95 % of packets match one of the first two handlers:
     probes = 0.95 x ~1.5  +  0.05 x ~50   =  1.4 + 2.5  =  ~4
Four probes, not fifty. The scan is already an O(1) dispatch wearing an O(n) loop — and getting
there costs one std::sort.
Predict. At 95/5 traffic, how much of the total available improvement does sorting the list capture, and how much is left for the table?
The measurement
Split the total available win between the one-line change and the rewrite. scan-ordered is given
every possible advantage — sorted by the true frequencies of the very stream it is then measured
on, which is better than any real system could manage.
The more skewed the traffic, the less the rewrite buys
The one-line competitor sorts the handler list by how often each handler is hit. It is given the true frequencies of the very stream it is measured on.
Before you look: at 95/5 traffic, how much of everything the table could save does sorting the list capture on its own?
Registration order, left to right and top to bottom. Positions are shuffled the way the benchmark's generator shuffles them, not its exact permutation.
matches() per packet: 88.2 unsorted, 5.7 sorted
Measured at 100 handlers. The sorted list's worst case is still 100 calls, and the table's is one lookup and a short list, which is the argument for the table that this chart does not show.
| traffic | total available | captured by std::sort | added by the table |
|---|---|---|---|
| uniform | 70.0 ns | 0.7 ns — 1 % | 69.3 ns — 99 % |
| zipf | 84.9 ns | 64.5 ns — 76 % | 20.4 ns — 24 % |
| 95/5 | 92.3 ns | 86.8 ns — 94 % | 5.5 ns — 6 % |
| worst | 107.5 ns | 104.2 ns — 97 % | 3.3 ns — 3 % |
At 95/5 traffic, where two protocols carry almost every packet, sorting the list captures 94 % of everything available, and the entire rewrite adds 6 %.
Everything, against the budget it has to fit inside
Nanoseconds per packet at 100 handlers. Each full track is 333 ns: one core at 3 million packets a second.
Measured. At 95/5 traffic, one std::sort takes the loop from 38% of the budget to
12%. The whole table rewrite takes it to 11%.
The pattern is the finding: the more skewed the traffic, the less the rewrite buys. Under uniform traffic there is no order to exploit and the table is the only thing that helps; under heavy skew it is almost redundant.
So why build the table at all?
Because that table is about the mean, and the mean is the wrong statistic for this decision.
scan-ordered is fast on average and its worst case is still 100 probes. The table’s worst case
is one lookup plus a bounded residual list.
A service that must not fall over when the traffic mix shifts — an attacker choosing which protocols to send, a new deployment, a misconfigured peer — is buying a bound, not an average. The table costs 6 % of the win at today’s distribution and removes the tail entirely.
That is a different argument from the one the speedup column makes, and it is the honest one. Notice
also that it is a requirements argument, not a performance one — which is the same shape of
reasoning that disqualified std::variant in §5.
Move-to-front is worse than doing nothing
199.2 ns against the plain scan’s 138.5 under uniform traffic. A self-organizing list pays a write on every hit to learn what a one-off sort already knows — and under uniform traffic there is nothing to learn, so the writes are pure cost. It only pays where the distribution is skewed and not known in advance.
The measurement nearly lied about its own headline
This is the most important paragraph in the post.
The first version of the packet generator assigned traffic weights to handlers 0, 1, 2 … in order. So the busiest handler was already first in the list, and sorting by frequency had nothing to fix.
Under that generator:
| sorting captured | with the bug fixed | |
|---|---|---|
| zipf | 5 % | 76 % |
| 95/5 | 4 % | 94 % |
The rigged run supports the exact opposite conclusion of this entire section — that the cheap competitor is worthless and the table is the only thing that helps. It was not noisy or obviously broken. It was clean, plausible, reproducible, and wrong.
Nobody registers handlers in traffic order by accident. A benchmark that assumes they did is
measuring its own generator. One std::shuffle is the most consequential line in the whole
benchmark.
The lesson: ask what your benchmark’s inputs assume, not just whether its code is correct. The most dangerous benchmark bug is the one that produces a believable answer.
11. How to benchmark something this small
This section is the most reusable thing here, even if you never touch a plugin ABI. Every item is a bug I actually hit, and several cost more than the effects being measured.
Keep the work alive without a compiler barrier
A single-threaded loop whose results are unused is a loop the optimizer may delete outright — and then you are benchmarking an empty loop and reporting a spectacular result.
The usual fix is a DoNotOptimize intrinsic. There is a better one available here: every arm
accumulates a checksum over the results it produces, and the checksums are asserted equal across
arms.
Checksum sum;
for (std::size_t i = 0; i < n; ++i) sum.feed(arm.dispatch(pkts[i]));
// ... later: check(sum.value() == reference, "arm agrees with the brief's loop");
One mechanism, two jobs: the optimizer escape and the correctness invariant are the same line. A faster arm that computes something different is not faster — and now it cannot pass.
The Go benchmarks in Finding Errors in Log Streams needed the same protection: every timed loop there feeds a package-level sink, and without it the numbers collapse to meaningless near-zero values.
Make sure your benchmark can fail
Deliberately break something and confirm the harness notices. Skipping the residual list in the table produced eight failures, from five distinct checks (one of them fails at all four handler counts), and exit code 1:
  FAIL: table-compact: agrees with the brief's loop on every packet
  FAIL: phase 2: scan and table agree at every handler count
  FAIL: uniform: every arm agrees with the brief's loop
  ...
CHECKS FAILED
A green result from a harness that never watched looks identical to a green result from correct code. Break it on purpose once, or you do not know which one you have.
Bug 1 — the packet pool was measuring DRAM
The first version used a 1 Mi-packet pool: 32 MiB, sitting exactly on this machine’s 36 MiB L3 boundary. Every arm was measuring memory bandwidth with a dispatch mechanism attached.
The tell was that the results stopped being monotonic — the table came out at 416 ns for 50 handlers and 380 ns for 100. A table cannot get faster when you add handlers. That is not a result, it is a symptom.
Fixed with a 1 MiB L2-resident pool, replayed enough times to keep the sample count fixed.
When results are non-monotonic in a parameter that can only make things worse, stop and find the artifact. Do not explain it; find it.
Bug 2 — the thread was migrating between core types
This is an Intel i9-13980HX: performance cores and efficiency cores in one package, and the OS scheduler will move a busy thread between them mid-run. A P-core and an E-core are not the same computer. The same arm measured twice landed in different columns.
SetThreadAffinityMask(GetCurrentThread(), 1ull);   // CPU 0 is a P-core
SetThreadPriority(GetCurrentThread(), THREAD_PRIORITY_HIGHEST);
On a hybrid CPU this is not tidiness. Without it, none of the numbers mean anything — and every modern laptop is now a hybrid CPU.
Bug 3 — repetition order was charging the last arm for thermal drift
This was the worst of the three, because it was completely invisible.
Running all repetitions of arm A, then all of arm B, lets the core’s clock drift down under sustained load. The arm that runs last pays for it.
  arm-major   AAAAAAAAA BBBBBBBBB     B is charged for the drift
              ^ fast              ^ slow          -> 27 % apart, stably

  rep-major   AB AB AB AB AB AB AB    drift is common-mode
              ^ both drift together   -> the difference is real
Two arms doing identical work came out 27 % apart, stably and reproducibly. That is worse than noise: noise looks like noise, and this looked like a result.
Measurement is now rep-major — one repetition of each arm, then the next. §6’s i-cache column is a difference between two arms, so those twelve cells are measured in a single interleaved set for exactly the same reason.
The cache stampede post measured its before-and-after pair the same way, alternating the two runs pair by pair so that drift on the machine landed on both.
The first run of a fresh binary is three times slow
Uniformly, across every arm — cold code pages, and a core that has not yet been asked to go fast. Phase 0 burns 500 ms before anything is timed, and the operating rule is: run it twice, read the second.
Establish the instrument before the results
Phase 0 prints, before any measurement depends on them:
- the clock’s smallest observable tick — 100.0 ns
- the empty-loop floor — 1.76 ns/packet (so an 8.57 ns measurement is signal, not floor)
- proof that the 100 handler bodies are genuinely distinct
That last check earns its place. Identical-code folding is a linker optimization that merges functions with identical machine code — normally benign, but here it would silently collapse 100 handler bodies into one and destroy §6’s entire instruction-cache measurement. The program would still be correct and the numbers would still look plausible.
And the first version of that check was itself wrong: it compared function addresses, which is worthless on a Windows PE binary because taking a function’s address can hand you a 64-byte jump thunk. It reported a 6 KiB span for a set the linker puts at 176 KiB. Calling all 100 and asserting 100 distinct results has no such failure mode.
Check your instrument before you trust your results — and prefer checks that test behaviour over checks that test representation.
What this machine cannot measure, and the substitute
There is no perf here — not on Windows, and not in this WSL2 install. No number in this post is a
hardware event count.
The substitute is a designed contrast: two arms with identical instruction counts differing only
in the property under test, with the delta reported in nanoseconds. §6’s i-cache column is exactly
that, with direct-call’s +0.10 ns as the control.
This is arguably the better measurement. A branch-miss count does not tell you whether you can afford it; 33 ns against a 333 ns budget does. Report effects in the unit your budget is denominated in.
12. When to do none of this
A Principal-level answer names the conditions under which it would not do the sophisticated thing. They are not rare.
Traffic is skewed and the worst case is not adversarial. §10 says it plainly: at 95/5, sorting gets 94 % of the win for one line any reviewer can check in ten seconds.
Predicates do not factor. The table earns its complexity in proportion to how many handlers own a key outright. If most predicates test a payload byte, most handlers end up in residual lists, the table degenerates into the loop it replaced, and you paid for a schema on the way.
Handlers are written by people who should not have to know about a global key space. This is the property nobody prices. In the brief’s loop, adding a handler requires understanding nothing outside it — write a predicate, register it, done. The table replaces that with a schema every future handler must fit, a collision policy, a residual bound, and a declaration that must stay in sync with the predicate. That cost is paid by every handler author forever, and it appears in no benchmark.
The ordering semantics are load-bearing. From §4: if operators reorder handlers to change behaviour — a completely reasonable feature for a protocol service — then first-match-over-an-ordered-list is a feature, and the table has to reimplement it explicitly.
I would ship the table for a service whose traffic mix is not under my control and whose tail latency is a commitment. I would ship the loop, sorted by observed frequency, for a service where it is — in one commit, and spend the rest of the week on something else.
13. What to take away
- A profiler attributes time to functions, not lines. “
dispatchis expensive” and “the virtual call is expensive” are different claims, and the gap between them is where the effort goes. - Fix selection before mechanism. O(n) → O(1) was worth ~75 ns; the whole dispatch mechanism costs 10, and the choice between mechanisms is worth 1.7.
- Some options are excluded by the requirements, not the benchmark. A closed sum type cannot admit a runtime type. That argument survives a faster machine; a benchmark result does not.
- The instruction cache can cost more than the thing you are optimizing. Here, two and a half times more on its own, three times with the mispredicted call target — and a one-handler microbenchmark cannot see it at all.
- Boundaries and hot paths are different problems. Nothing obliges them to share a mechanism, and the strongest answer refuses the framing that says they must.
- A C ABI is not about portability in the abstract. One decision makes four silent failure modes impossible: allocator mismatch, ODR merge, unwinder mismatch, and type identity.
- Measure the input distribution, not just the code. The number the brief withheld decided the whole answer, and a generator bug nearly reversed it.
- Every benchmark needs a control that should read zero. Without
direct-call’s +0.10 ns, the 33 ns i-cache figure would be an assertion. - Write down what would change your mind, then let it. Three claims here turned out wrong. They are more useful than the ones that were right.
Apply it to your own system
A checklist you can run against a dispatch path you own:
- What is your per-item budget? Compute it from the target rate before anything else.
- Does your hot path contain a search? How many comparisons per item, on average and worst case?
- What is the actual distribution of your inputs? Not the uniform one you assumed — measure it.
- Would sorting your candidates by observed frequency capture most of the win? Try it first; it is one line.
- Does reordering change behaviour? If any two predicates overlap, it does.
- How much code is reachable from your hot path? Compare it to 32 KiB.
- Does your benchmark have a control arm that should read zero?
- Is your benchmark pinned to one core? On a hybrid CPU, is it a P-core?
- Are your arms measured rep-major or arm-major?
- Have you broken it on purpose to confirm it can fail?
Run it yourself
The benchmark, the plugin ABI and the probes are in principal-katas. On Windows, with CMake, Ninja and clang 20 or newer on the path (the run in this post used clang 21.1.7, and the current Visual Studio standard library refuses anything older than 20):
git clone https://github.com/shaia/principal-katas
cd principal-katas
git checkout 257da09620c904ef45b75ae93cb742ce257d4d23
cd plugin-dispatch-kata
cmake -S cpp -B cpp/build -G Ninja -DCMAKE_BUILD_TYPE=Release -DCMAKE_CXX_COMPILER=clang++
cmake --build cpp/build
cd cpp/bin && ./solution.exe        # exit code is the verdict; run twice, read the second
The ELF-only ABI probes need WSL, since RTLD_LOCAL and type_info identity have no PE equivalent.
From a WSL shell with g++ and make, at the root of the same checkout:
cd plugin-dispatch-kata/cpp/abi-probe
make run && make abi-break
The kata keeps its own copies of these figures as matplotlib images, generated from the same recorded numbers. To regenerate them, from the root of the checkout:
py -3 plugin-dispatch-kata/doc/figures/make_figures.py
Things worth trying to the code, in rough order of how much they teach:
- Change
kHandlersinconfig.hppfrom 100 to 500 and rerun. Which arms degrade, and which do not? - Add a fifth distribution to
packet.hppmatching your traffic, and redo §10’s table. - Delete the
std::shuffleinbuild_cdfand watch §10’s conclusion invert. - Set
kFatRoundsingenerated.hppto 2 so the handler set nearly fits in L1i, and watch §6’s effect shrink to the 7 to 9 ns of mispredicted call target. - Comment out
pin_to_one_core()and see how much run-to-run variance returns.
Further reading: the kata itself (11 steps, answer folded at the bottom) · the C++ track · the worked answer · the same question in Go and Python, where the premise breaks in two different places.
A note on the evidence
What I observed. Every measured number in the post comes from one benchmark binary, built with clang
21.1.7 targeting x86_64-pc-windows-msvc in Release, on an Intel i9-13980HX laptop running Windows
11. That CPU has 8 performance cores and 16 efficiency cores, which is why the harness pins its thread
to CPU 0, and the numbers are from the second invocation of the binary. The tables and figures use the
run recorded when the kata was written, the one its make_figures.py keeps. I rebuilt and re-ran it on
12 September 2026 on the same machine, and no conclusion moved. At 100 handlers the loop and table
arms read 143.5 and 68.0 ns (recorded: 142.8 and 67.8), and the call counts were identical. Sorting
captured 94.3% of the win at 95/5 (recorded: 94%). The mechanisms still ranked erasure, virtual,
variant, at 8.79, 10.64 and 11.52 ns (8.57, 10.24, 10.98), and the i-cache column read 33.6 to 39.0 ns
against a 0.12 ns control (33.0 to 36.8, against 0.10). The largest difference was the loop at 50
handlers, 105.7 ns against 119.2. The plugin crossing read +3.1 ns per packet and +2.9 batched, so
batching recovered 0.2 ns rather than nothing.
I checked two of §11’s claims by breaking the code in a scratch checkout. Skipping TableCompact’s
residual list produced eight FAIL lines, from five distinct checks, and exit code 1. Deleting the
std::shuffle from the generator took sorting’s share of the win to −1% at zipf and 1% at 95/5; the
benchmark’s first version, which had that bug, recorded 5% and 4%. Other work was running on the
machine during those builds, including a compile under WSL, and their absolute nanoseconds came out up
to three times the clean run’s, so I use only their pass/fail results and the ratios within each run.
The ABI probes ran under WSL2 Ubuntu with g++ 13.3 and printed what §9 shows, at different addresses.
What I computed rather than measured. The 52.2 expected calls per packet in §3 comes from enumerating the benchmark’s handler set and every payload value, not from running it. Splitting §6’s 33.7 ns into about 9 ns of mispredicted call target and about 25 ns of instruction cache started as subtraction across arms. A second build with every handler at the tiny size, on the same machine, left gaps of 9.0, 7.2 and 9.4 ns, which is the subtraction to within a quarter of a nanosecond. The latency table in §2 is orders of magnitude, as it says.
What I did not measure. No hardware counters: there is no perf on this machine, on Windows or in
WSL2, so every instruction-cache and branch-prediction effect here is a designed contrast in
nanoseconds. The 32 KiB L1i is the usual size for this class of core, not a figure I read from the
machine. The heap probe saw one libstdc++ and so one heap; two heaps are what you get from a plugin
that links the C++ runtime statically, and I did not build one. The 416 and 380 ns from the 32 MiB
pool, the 27% from arm-major ordering, the three-times-slow first run and the 6 KiB span of jump
thunks are what earlier versions of the harness reported, as its source comments record; I did not
rebuild those versions. Every absolute number belongs to one hybrid laptop. A CPU without efficiency
cores, or another compiler, will print different nanoseconds, and I would expect the same shape.
What I corrected. The draft this post was ported from, and the kata’s README and worked answer, said the loop spends 142.8 ns “before any handler does useful work”. That figure includes the handler’s own work, which the table arm pays as well; the search is the 75 ns between them. They also credited the whole hot-to-mixed gap to the instruction cache, called the choice between mechanisms worth 10 ns rather than 1.7, gave the expected call count as 51.7, and counted eight failures as eight distinct ones. All of that is fixed in the kata, in 6e0ad6a.
What I would still change. The harness reports a typical per-packet cost for each arm, the median of nine repetitions, and §10’s case for the table rests on the worst case, which nothing in it reports. A tail percentile per arm, and a counter-based run on Linux that counts the cache misses and branch misses behind §6’s column directly, are the two things I would add next.