Phase coexistence
The puzzle: who decides where the flat line goes?
Module 02 ended on a cliff-hanger. Below its critical temperature the van der Waals isotherm does something no gas has ever been seen to do: between two points it rises as the volume grows, so that squeezing the fluid would lower its pressure. Module 09 has since named the crime. A state with has a negative compressibility, its entropy surface is convex there instead of concave, and the smallest fluctuation would tear it apart. The segment between the loop’s minimum and its maximum cannot be an equilibrium state of anything.
Real carbon dioxide does something else entirely.
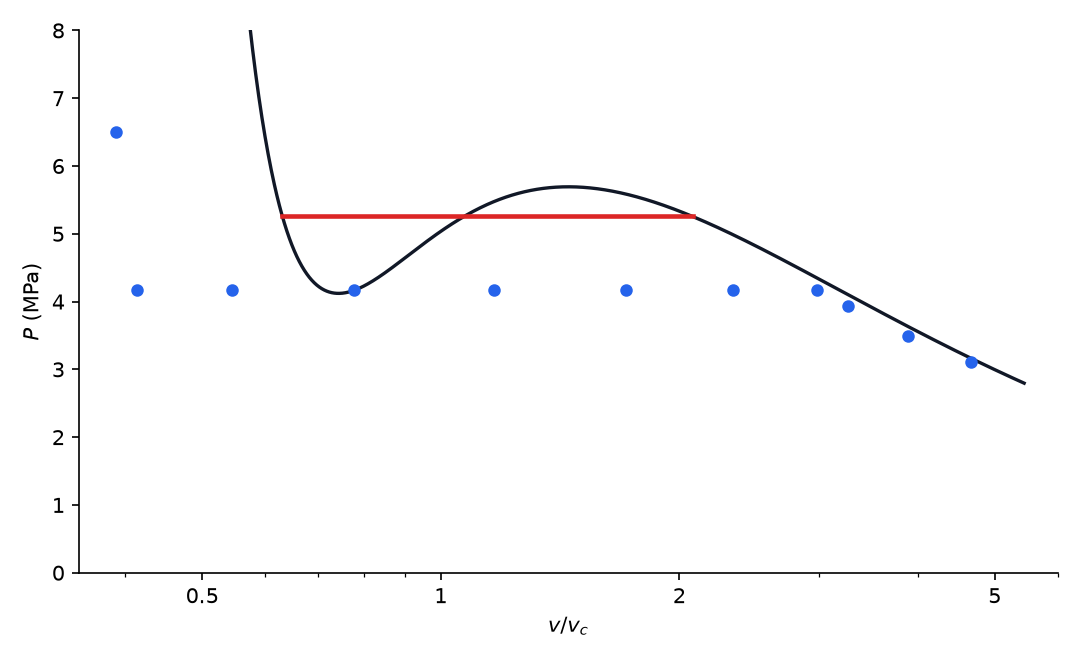
Carbon dioxide at , well below its critical temperature of . Blue dots: the measured isotherm of module 02. Black: the bare van der Waals equation with and fitted to the critical point. Red: the horizontal line this module will put through the loop. The data do not loop. They run perfectly flat from to at one pressure, because across that whole range the cylinder holds liquid and vapour side by side, and compressing it turns vapour into liquid without changing the pressure at all. The model’s line sits too high — the model is quantitatively poor for this substance — but it is the right kind of answer, and this module is about why.
So nature replaces the loop with a flat line. But the model offers a continuum of horizontal chords through the loop, one for every pressure between the loop’s minimum and its maximum. Pick one too high and liquid sits in the cylinder next to vapour at a pressure the liquid “prefers”; pick one too low and the vapour does. Something physical selects exactly one.
The answer is the payoff of the last three modules together. Two phases in a cylinder exchange energy, volume and particles, so by modules 09 and 13 they must agree on , on and on the chemical potential . The third condition is the one that chooses the line, and it does so through module 13’s Gibbs–Duhem relation: integrate along the model isotherm from the liquid state to the gas state, demand that come back to the same value, and the famous “equal areas” fall out as a theorem. From that one line everything else in the module follows: the fractions of liquid and vapour in a half-full cylinder, the slope of the boiling curve, the latent heat, the number of things you can vary with two phases present — and why water boils at on the top of Everest.
Predict before you calculate
Commit to an answer for each of these before reading on. Write them down.
Where does the flat line sit: at the top of the loop, at the bottom, or somewhere forced by a rule? If a rule, what kind of rule — sketch where you think the line goes and say why.
Water boils on a mountain high, where the air pressure is about 0.7 of its sea-level value. Does it boil above , below, or at exactly ?
A kettle is at a rolling boil with a thermometer in the water. The burner is turned up to double the heat. What does the thermometer do over the next minute?
A strong sealed container is half full of liquid carbon dioxide with its vapour above it, and is heated past the critical temperature. Does the liquid boil away? Does the vapour condense? Or does something stranger happen?
Explore the model
The laboratory reopens module 02’s sub-critical isotherm and lets you drag the temperature. For each temperature it draws the loop, marks the two points where its slope changes sign, puts the flat line through it with the two cut-off lobes shaded, and shows the chemical potential along the isotherm plotted against the pressure, which crosses itself at exactly the line’s height. It then assembles the line’s height at every temperature into the pressure–temperature diagram, walks a state point across the flat segment to watch the liquid fraction follow the lever rule, and finally fits the published vapour-pressure curve of water to extract its latent heat.
One van der Waals isotherm as its temperature rises from toward . Left: the loop (black), the flat line at the saturation pressure (red) cutting off two lobes, blue below the line and red above it, which have equal areas at every temperature; the orange dots are the spinodal points, where the slope changes sign; the grey dashed dome is the locus of the line’s two ends over all temperatures, the coexistence curve, with the critical point at its top. Right: the chemical potential along the isotherm, plotted against the pressure, as a loop with a self-crossing; the crossing (red dot) sits at exactly . As the lobes shrink, the two ends of the line approach each other as , and the construction collapses onto the critical point.
The coexistence point climbing the boiling curve. Left: the – plane with the binodal (grey dome, shaded): every point inside it is a mixture of liquid and vapour, and the flat line (red) at the current temperature spans it; the inner dotted orange dome is the spinodal, the locus of the loop’s minima and maxima, inside which no single phase can exist at all. Right: the same red point in the – plane. Its path is the saturation curve — the boiling curve of the substance — and it ends at the critical point (hollow circle), beyond which there is no line to cross and no distinction between liquid and gas.
Run the laboratory now, then come back. Four things are worth doing before you read on:
Slide the temperature up toward and watch what happens to the two shaded lobes, to the distance between the ends of the flat line, and to the loop in the – panel.
Toggle the – loop on, and check where it crosses itself against the height of the line.
Walk the state point across the flat segment and watch the liquid fraction. Stop halfway and ask what, physically, is in the cylinder.
Fit the water data over a narrow window of temperatures and over a wide one, and see which gives the latent heat closer to the tabulated value at — and why.
Derive the result
System and boundary. A fixed amount of one substance in a cylinder with a piston, held at temperature by a bath, and free to separate into two homogeneous parts — a liquid and a gas — that can exchange energy, volume and particles with each other across their common surface. Interfaces cost nothing: the two phases are treated as two bulk systems in contact.
Independent variables. Per particle: the volume , the entropy , the energy , and the pressure and chemical potential as functions of them. Subscripts and mark the liquid and the gas.
Sign convention. The course convention holds, , with along the flat line; it enters only in step 6, where the latent heat is a heat. Everything else below is a statement about state functions, and every differential is an exact .
Route. Seven steps. Module 09’s stability criterion condemns the loop; modules 09 and 13 give the three coexistence conditions; the third of them, integrated along the isotherm with Gibbs–Duhem, is the equal-area theorem; the lever rule follows from counting particles; differentiating equality along the boiling curve gives Clausius–Clapeyron; the model’s entropy gives the latent heat, twice; and counting constraints gives the phase rule.
Step 1: the loop is forbidden, and where it ends
Module 09 showed that a concave entropy surface is the condition for a stable equilibrium, and that one of its consequences, read through module 10’s potentials, is
Differentiate the model isotherm:
This vanishes where
a condition with two solutions below — the loop’s minimum, on the liquid side, and its maximum, on the gas side — and none above it. The two solutions are the spinodal points of the isotherm, and their locus over all temperatures is the spinodal curve. Between them the isotherm is forbidden outright. Outside them the slope is negative again and the criterion is satisfied; whether those outer segments are the equilibrium state is the next question, and the answer is: not all of them.
Step 2: the three conditions for coexistence
Let the cylinder hold particles of liquid and of gas. The two parts exchange energy, volume and particles, and the whole is at fixed and . Module 09’s argument for energy exchange gave ; its argument for a movable wall gave ; module 13’s argument for particle exchange — maximize the total entropy over the split of at fixed total energy — gave . The same three conditions follow in one line from module 10: at fixed and the Gibbs free energy is minimal, and for two phases of one component with fixed, which is minimal over the split only if the two chemical potentials agree — or if one phase has vanished.
The first two conditions are built into the picture of a flat line on an isotherm. The third is the one that selects its height.
Step 3: the equal-area theorem
Module 13’s advanced section re-read the Gibbs–Duhem relation as a statement about : per particle, . At fixed temperature,
Now walk along the model isotherm from the liquid state to the gas state , through the loop, and add up the changes in . The walk passes through the forbidden segment, but is a function the model defines at every , and a line integral of a state function does not care whether the states it passes through are stable. Along the walk,
Coexistence requires the left side to vanish. Integrate the right side by parts: the states at both ends share the pressure , so
The equation is one condition on one unknown. For a pressure between the loop’s minimum and maximum, the horizontal line cuts the isotherm three times; the outer two crossings are the candidate liquid and gas. Raise the line and the lower lobe grows while the upper one shrinks, so the difference of the areas is a decreasing function of and vanishes exactly once: there is a unique at every . The laboratory finds it by bisection. The middle crossing, inside the forbidden segment, is never a state.
Two things are worth seeing in the laboratory’s – panel. Plotted against the pressure, along the isotherm is a curve that doubles back on itself twice — at the two spinodal points, where while does too — and so crosses itself exactly once. The crossing is at : the theorem made visible. And the two branches that continue past the crossing, the liquid branch above carried on to lower pressure and the gas branch carried on to higher, are states that satisfy the stability criterion but have the higher of the two available chemical potentials. They are the metastable branches, and step 7 returns to them.
For the van der Waals model has a closed form, derived in the problem set:
with a function of temperature alone that drops out of any comparison at fixed . So the laboratory can find a second way, by bisecting directly with no areas in sight, and check that the two answers agree. They agree to rounding.
Step 4: the lever rule
Inside the flat segment, a cylinder at total volume per particle holds a fraction of its particles as liquid at and as gas at . The volumes add, , and solving,
This is the lever rule: the state point on the flat line is a fulcrum, and the two phase fractions are inversely proportional to the arms and . Halfway across the segment, — half the particles are gas — but since , by a large factor well below , the gas takes most of the room, and the cylinder looks mostly full of vapour with a layer of liquid at the bottom. Nothing in the cylinder is “half evaporated”: every particle is in one phase or the other, and the two coexist.
A state point crossing the two-phase region at . Left: the isotherm with the loop dashed in grey and the equilibrium isotherm in black — flat (red) between and — and the state point (blue) moving along it. Middle: the cylinder, drawn to scale in , with the liquid (blue) at the bottom and the vapour (pale) above it; the liquid occupies the volume . Right: the particle fractions (blue) and (orange) from the lever rule. Across the flat line the pressure does not move at all; only the proportions do, and halfway across, where half the particles are liquid, the liquid is a thin layer because its volume per particle is so much smaller.
Step 5: Clausius–Clapeyron
Step 2 fixed one pressure at each temperature. Follow it: along the boiling curve the two chemical potentials are equal at every point, , so their changes along the curve are equal too. Differentiate both sides along the curve with Gibbs–Duhem, :
The slope of the boiling curve is set by the entropy the substance gains per unit of volume it gains. For boiling, and , so always rises with — hotter liquids have higher vapour pressures. Turn it around and it says how the boiling point moves with pressure: a liquid boils at the temperature where equals the pressure pressing on it. Lower the pressure and the boiling point falls; raise it, in a pressure cooker, and it rises. “” is not a property of water. It is the temperature at which water’s happens to equal one atmosphere.
For a vapour dilute enough to be ideal and far less dense than the liquid, , and the equation separates:
Step 6: the latent heat of the model, two ways
The van der Waals gas has the entropy per particle (module 10, with the Sackur–Tetrode form corrected for the excluded volume)
so at one temperature the two phases differ only through their free volumes :
As the two volumes merge and : above the critical temperature there is nothing left to boil. A second route uses the first law. Along the flat line the pressure is constant, the work done on the system in carrying one particle across is , and the heat is
since the model’s energy per particle is and the kinetic part cancels at one temperature. The two expressions look nothing alike. They are equal — exactly — at the equal-area pressure and at no other, because their difference is in disguise (problem 2 asks you to show it). The laboratory asserts their equality to rounding; it is the theorem of step 3 checked a third way.
Step 7: the phase rule
How many intensive variables can be chosen freely while phases of components coexist? Each phase has its temperature and pressure and independent composition fractions, and and are shared, so there are knobs. Each component must have the same chemical potential in every phase — equations per component, in all. The difference is the number of knobs left:
For one component: a single phase has and fills an area of the – plane; two phases have and lie on a curve — fix and is determined, which is step 2 again; three phases have and meet at a point, the triple point, whose temperature and pressure are properties of the substance ( and for water, by which the kelvin was defined until 2019). Four phases of one component cannot coexist at all. The critical point is not a phase-rule feature: it is where the liquid–gas curve stops being a boundary, because the two phases it separated have become one.
Metastability: the states between the curves
Step 1 forbade only the segment between the spinodal points. Step 3 found that the liquid branch continues below and the gas branch above it, each with a negative slope and a positive compressibility, each a legitimate solution of the stability criterion — and each with a chemical potential higher than the other phase’s at the same . Those are the states between the binodal (the coexistence curve, the dome in the – plane) and the spinodal (the locus of the loop’s extremes, the inner dome).
Verify computationally
Every number below comes from thermolab.phases, with carbon dioxide’s and fitted to
its critical point as in module 02, so that . The working temperature
is , which is .
1. The anatomy of one isotherm. At the loop’s minimum is at and , its maximum at and ; between those two volumes the slope is positive and the states are forbidden. The construction puts the flat line at , with and — outside the spinodal points, as step 1 requires. The lobe above the line and the lobe below it each have area per particle, ; they agree to one part in 1010, the resolution of the quadrature used to check them.
2. Equal areas is equal mu. Bisecting the area difference and bisecting — two different residuals, evaluated from two different formulas — return the same and the same two volumes to the last digit at , and across the solver’s whole domain, from to , to better than 10-12 in the pressure. At the solution the chemical potentials of the two phases differ by less than . The construction is the theorem, computed.
3. The metastable branches. The liquid branch can be followed below as far as the loop’s minimum, where its chemical potential has risen above the coexistence value; the gas branch above to the maximum, above it. They are small numbers: a superheated liquid is only slightly worse off than the vapour it could become, which is why a seed is needed to tip it.
4. Two latent heats. From the entropies, , which is per molecule. From the first law, ; the two agree to . Moving away from by one percent in either direction makes them disagree, as step 6 says they must.
5. The curve ends. Sweeping the temperature toward : at 0.75, 0.85, 0.95, 0.99 and the latent heat is 6.69, 5.46, 3.31, 1.51 and , and is 5.15, 2.57, 1.04, 0.41 and 0.127 — the last three in the ratio to within a few percent. Both vanish at , the latent heat because the two phases it separates have become one. At exactly, the construction returns .
Two routes from gas to liquid. Left: the – plane with the coexistence curve (black) ending at the critical point (hollow circle). The red path crosses the curve at ; the blue path goes around its end, out past , up past , and back. Right: the density along each path. Where the red path crosses the curve the density jumps by a factor of six — that is condensation. The blue path starts in the same gas and ends in the same liquid, and its density rises steeply but continuously all the way. Nothing is exhausted at the critical point and nothing boils there; the distinction between the two phases simply stops existing, and a gas can be turned into a liquid without ever crossing a boundary.
6. Against reality. The model was built to reproduce the structure of coexistence, and it does; its numbers are another matter. At the measured saturation pressure of carbon dioxide is against the model’s 5.255 — high — and the discrepancy grows as the temperature falls: a factor 1.04 at , 1.26 at 280, 1.79 at 250 and 3.1 at the triple point, . The latent heat can be checked with no model at all: Clausius–Clapeyron applied to the measured curve, whose slope at is , with the measured volume change read off module 02’s plateau, , gives — more than twice the model’s 4.1. A mean-field attraction fitted at the critical point is simply too weak to hold a liquid together far below it.
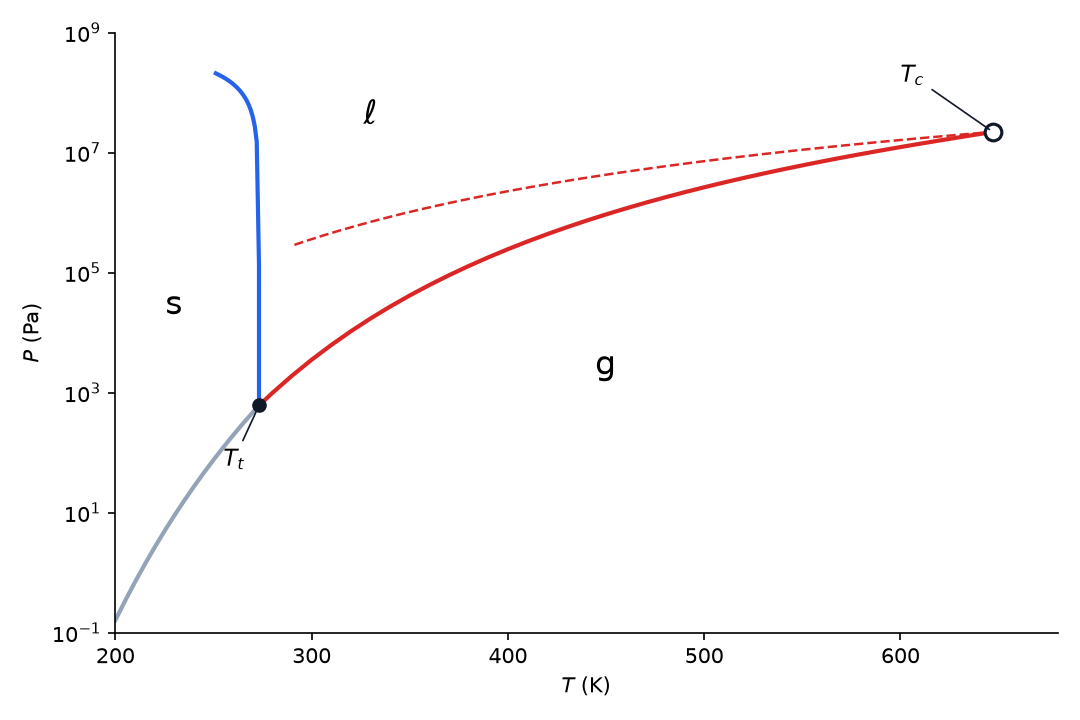
The real phase diagram of water, from the published boundary equations shipped with the laboratory: sublimation of ice (grey), melting (blue, leaning left — ice melts under pressure, which is why it contracts on melting), and vaporization (red), meeting at the triple point (black dot, , ) and the vaporization curve ending at the critical point (hollow circle, , ). The regions are solid (s), liquid () and gas (g): areas have , the curves , the triple point . The red dashed curve is the van der Waals boiling curve for water with and from water’s critical point: at it predicts instead of 0.101, fifteen times too high, and a latent heat of against the real 40.7. Water is held together by hydrogen bonds, which a mean-field does not describe. The model has no solid, so it has no melting curve and no triple point at all.
7. A measurement: the latent heat of water. The laboratory fits against to the published saturation curve of water — 31 points from 275 to , the equation behind every steam table — using the integrated form of step 5.
The same narrow fit answers the predictions: at water boils at , at the of Everest’s summit at , and in a pressure cooker at at .
The falsifying experiments. Two of this module’s misconceptions can be tested with a kettle. For “water boils at , full stop”: the saturation curve above is the refutation — boiling happens where meets the pressure on the liquid, and every point of the curve is a boiling point at some pressure; a thermometer in boiling water at (Denver, ) reads . For “the heat keeps raising the temperature”: put a thermometer in a kettle, bring it to a rolling boil, and log the reading every ten seconds while you turn the burner up — the temperature holds at the boiling point to within the thermometer’s resolution for as long as there is water, however hard the burner runs. Only the rate of boiling changes. The heat is going into , the entropy difference between the two phases, at fixed . The third misconception, “the critical point is where the liquid runs out”, is refuted by the blue path in the animation above: nothing runs out, and gas becomes liquid without any event along the way.
Transfer the idea
Wherever two phases of one substance can trade particles, equilibrium is equal , and everything here follows.
Back to module 02. The open question that module left — what the loop means — is closed: it is the model’s attempt to interpolate through a region where no homogeneous state exists, and the construction replaces it by the flat line nature draws. The model’s isotherms are reused unchanged; the only addition is .
Back to modules 09 and 13. Both did real work here: the stability criterion condemned the segment between the spinodals, and equality chose the line. A student who found the chemical potential abstract in module 13 has now watched it decide at what pressure a cylinder of carbon dioxide liquefies.
Forward to module 15. The coexistence curve ends. Approaching its end the latent heat vanishes and the two densities merge as . What kind of transition has no latent heat, what the real exponent is, and why it is the same for a fluid and a magnet, is the next module’s opening puzzle, with the Ising model as its laboratory.
Forward to module 17. A Bose gas cooled past a critical temperature has its chemical potential pinned at the lowest level, the way is pinned on the flat line — and the macroscopic occupation of that level is a condensation in the same sense as this module’s: Bose–Einstein condensation is a phase transition.
Pressure cookers and mountains. At water boils at and rice cooks in a third of the time; at it boils at and an egg never sets. Both are the same curve read in the other direction.
Freeze-drying. Below the triple point’s pressure, , there is no liquid water at any temperature: frozen food in a vacuum chamber loses its ice straight to vapour along the sublimation curve, which is how instant coffee is made without ever heating it.
Humidity and dew. Air holds water vapour up to the partial pressure ; relative humidity is the ratio, and the dew point is the temperature at which the vapour present reaches the curve. The exponential rise of with is why warm air holds so much more water, and why a night can wring it out.
Ice skating, in part. Ice’s melting curve leans left: pressure lowers its melting point, by per bar, because ice is less dense than water and Clausius–Clapeyron has . A skater’s pressure accounts for a few hundredths of a degree, far too little to melt cold ice; the slipperiness of ice is mostly surface melting and friction, which is a different story.
Looking ahead:
Module 15 takes the end of the coexistence curve seriously: order parameters, critical exponents, and a model in which the transition can be simulated particle by particle.
Module 17 treats Bose–Einstein condensation as the phase transition this module makes it possible to recognize.
Module 18 asks how fast a system that has been pushed past its binodal finds its way to the new phase; this module has only said where it ends up.
Worked examples
Try each one before opening its solution.
Worked example 1 — the lever rule. At some temperature the coexisting volumes of a fluid are and . A cylinder holds the fluid at an average . What fraction of the molecules is vapour, and what fraction of the volume does the liquid occupy?
Solution
, so . The liquid’s volume per mole of fluid is , which is of the cylinder. Two thirds of the molecules occupy a third of the room.
Worked example 2 — a pressure cooker. Water boils at at with . Estimate its boiling point at .
Solution
In the integrated form, . So and . The laboratory’s fit to the real curve gives ; the small difference is ’s decrease with temperature.
Worked example 3 — a latent heat from two pressures. Water’s saturation pressure is at and at . Estimate .
Solution
. The tabulated value at is 40.7; the excess is the ideal-vapour approximation and the average, in that order.
Worked example 4 — the model’s latent heat. For the van der Waals fluid at in the verification, and with . Find in per molecule and in .
Solution
. Per mole, . The real value for carbon dioxide at this temperature is : the model’s attraction is too weak.
Worked example 5 — counting freedoms. How many intensive variables can be chosen freely for (a) liquid water alone, (b) water boiling in an open kettle, (c) water, ice and vapour in a sealed cell, (d) a salt solution in equilibrium with its vapour?
Solution
(a) , : , both and . (b) : ; the atmosphere fixes , so is fixed too, at at sea level. (c) : ; the cell sits at the triple point and nothing can be varied. (d) (water and salt), : — at a given the vapour pressure can still be changed, by changing the concentration, which is why salt water boils above .
Worked example 6 — reading the spinodal. For the van der Waals fluid the loop’s extremes obey . Show that this has no solution above .
Solution
The right-hand side, as a function of , rises from zero, peaks, and falls back toward zero as . Its maximum is where its derivative vanishes: , i.e. , . There the right side is . So for the equation has no solution, the slope never changes sign, and the isotherm has no loop — the critical point is where the two spinodal points, and the two coexisting phases, meet.
Check your understanding
Below its critical temperature the van der Waals isotherm loops: between two points it rises as the volume grows. Which part of the isotherm cannot describe any equilibrium state, and why?
A. The segment between the loop’s minimum and its maximum, where (dP/dv)_T > 0 -- a positive slope means a negative compressibility, which module 09’s stability criterion forbids. B. The whole sub-critical isotherm, because real fluids never loop. C. Only the part of the loop where the pressure is negative. D. The gas tail at large volume, because the vapour is not an ideal gas there.
Check your answer
Correct answer: A — The segment between the loop’s minimum and its maximum, where (dP/dv)_T > 0 -- a positive slope means a negative compressibility, which module 09’s stability criterion forbids.
A. Right. Between the two spinodal points, where the slope changes sign, a density fluctuation lowers the pressure where the fluid is denser and grows without limit; the entropy is convex there instead of concave. Outside them the slope is negative again and the states are at least metastable.
B. Real fluids do not loop, but the outer parts of the model isotherm are perfectly good liquid and gas states; the construction keeps them and replaces only the middle with a flat line. Only the segment with a positive slope is forbidden outright.
C. A negative pressure is a liquid under tension, which is a real state (sap in trees, water in capillaries). What is forbidden is a positive slope, whatever the sign of the pressure -- and below 27/32 of T_c some of the forbidden segment is at positive pressure.
D. Non-ideality is the model’s whole point and is no crime. The gas branch has a negative slope, satisfies the stability criterion, and is the state the fluid is actually in at low pressure.
A horizontal line through the loop can be drawn at any pressure between the loop’s minimum and its maximum. What fixes the one nature draws?
A. Equal chemical potentials of the two phases -- which, with d mu = v dP at fixed T integrated along the isotherm, is the same statement as “the two lobes cut off by the line have equal areas”. B. The line is drawn where the two areas look equal -- a graphical convention that gives sensible results. C. The pressure at the loop’s maximum, since above it there is no gas state. D. The average of the loop’s minimum and maximum pressures.
Check your answer
Correct answer: A — Equal chemical potentials of the two phases -- which, with d mu = v dP at fixed T integrated along the isotherm, is the same statement as “the two lobes cut off by the line have equal areas”.
A. Right. Two phases exchanging particles equilibrate at equal mu (module 13). Integrating d mu = v dP along the model isotherm from the liquid state to the gas state and demanding mu_gas = mu_liq gives, by parts, integral of P dv = P_sat (v_gas - v_liq): equal areas, as a theorem.
B. This is the misconception the module is built to confront. Equal areas is not a convention: it is what mu_gas = mu_liq becomes when d mu = v dP is integrated along the isotherm. A line at any other height leaves the two phases with different chemical potentials, and particles would flow from one to the other.
C. At the loop’s maximum the gas state coincides with the forbidden segment; the lower lobe would have all the area and the upper none. The chemical potentials are not equal there, so it is not an equilibrium.
D. Nothing physical singles out that average. The line is fixed by the areas, which depend on the whole shape of the loop, not on its two extremes.
At some temperature a fluid’s coexisting volumes are v_liq = 0.080 L/mol and v_gas = 0.270 L/mol. A cylinder holds the fluid at an average volume of 0.150 L/mol. What fraction of the molecules is vapour?
Check your answer
Correct answer: 0.368 (± 0.006)
Lever rule: x_gas = (v - v_liq)/(v_gas - v_liq) = (0.150 - 0.080)/(0.270 - 0.080) = 0.070/0.190 = 0.368. If you answered 0.632, you gave the liquid fraction; if 0.556, you divided by v_gas instead of by the width of the flat segment.
Water is brought to the boil in an open pan on a mountain 3000 m high, where the air pressure is about 0.7 atm. At what temperature does it boil?
A. Below 100 C -- at about 90 C -- because water boils where its saturation pressure P_sat(T) equals the pressure on it, and P_sat reaches 0.7 atm at about 363 K. B. At exactly 100 C -- altitude is irrelevant, because the boiling point is a property of water. C. Above 100 C, because the thinner air carries heat away more slowly. D. It does not boil at all, because 0.7 atm is below the triple-point pressure.
Check your answer
Correct answer: A — Below 100 C -- at about 90 C -- because water boils where its saturation pressure P_sat(T) equals the pressure on it, and P_sat reaches 0.7 atm at about 363 K.
A. Right. Boiling is the point where P_sat(T) meets the ambient pressure. P_sat rises with T (Clausius-Clapeyron), so a lower ambient pressure is reached at a lower temperature: the laboratory’s fit gives 363.5 K at 0.7 atm, and 71 C at the 0.33 atm of Everest’s summit.
B. This is the misconception that 100 C is written on the water molecule. It is the temperature at which water’s saturation pressure happens to equal one atmosphere; at 0.7 atm the same curve is crossed at about 90 C, which is why tea tastes weak on mountains and pressure cookers exist.
C. How fast heat leaves the pan sets how fast the water boils, not the temperature at which it does. The boiling temperature is fixed by P_sat(T) = ambient pressure, which at 0.7 atm is below 100 C.
D. The triple-point pressure of water is 611 Pa, about 0.006 atm; 0.7 atm is far above it. Liquid water exists and boils at 0.7 atm, at about 90 C.
Water’s saturation pressure is 70.2 kPa at 363.15 K and 101.4 kPa at 373.15 K. Treating the vapour as ideal and L as constant, estimate the latent heat of vaporization in kJ/mol (R = 8.314 J/(mol K)).
Check your answer
Correct answer: 41.5 (± 0.6)
ln(P_2/P_1) = (L/R)(1/T_1 - 1/T_2), so L = R ln(101.4/70.2)/(1/363.15 - 1/373.15) = 8.314 x 0.3677/(7.378 x 10^(-5)) = 41.4 kJ/mol. The tabulated value at 100 C is 40.7; the excess is the ideal-vapour approximation and the 10 K average. If you answered about 0.041, you forgot the factor 10^3 in kJ; if about 4.98, you left out R.
A kettle is at a rolling boil at atmospheric pressure, with a thermometer in the water. The burner is turned up to deliver twice the heat. What does the thermometer do over the next minute?
A. It stays at the boiling point; the water boils twice as fast, and the extra heat goes into the latent heat L = T (s_gas - s_liq) of the molecules leaving the liquid. B. It climbs, just more slowly than it did before the water began to boil. C. It climbs twice as fast as before. D. It drops slightly, because faster evaporation cools the water.
Check your answer
Correct answer: A — It stays at the boiling point; the water boils twice as fast, and the extra heat goes into the latent heat L = T (s_gas - s_liq) of the molecules leaving the liquid.
A. Right. At fixed pressure the two phases can only coexist at the one temperature where P_sat(T) equals that pressure. Heat poured in is spent carrying molecules from liquid to vapour at that temperature -- the latent heat -- and only the rate of boiling changes. A thermometer logged while the burner is turned up shows a flat line.
B. This is the misconception that added heat always raises the temperature. While liquid and vapour coexist at fixed pressure the temperature is pinned at the boiling point; the heat goes into the entropy difference between the phases, not into the temperature. Only when the last of the liquid is gone can the temperature rise again.
C. Before boiling, doubling the heat doubles the warming rate. Once the water boils the temperature stops rising altogether, at any burner setting -- the heat is absorbed as latent heat at fixed T.
D. Evaporation cools a liquid that is below its boiling point and losing molecules to unsaturated air. A boiling liquid is at P_sat(T) = ambient pressure and sits exactly at the boiling point, neither above nor below.
How many intensive variables can be varied independently while ice, liquid water and water vapour coexist in a sealed cell?
A. None -- F = C - P + 2 = 1 - 3 + 2 = 0; the triple point is a single point in the P-T plane, at 273.16 K and 611.657 Pa. B. One -- you can still slide along the melting curve while keeping all three phases. C. Two -- temperature and pressure, as for any system. D. Three -- one for each phase present.
Check your answer
Correct answer: A — None -- F = C - P + 2 = 1 - 3 + 2 = 0; the triple point is a single point in the P-T plane, at 273.16 K and 611.657 Pa.
A. Right. Three phases of one component impose two independent mu-equality conditions on the two variables T and P, leaving none free. That is why the triple point of water could serve as the definition of the kelvin: it is the same in every cell.
B. Along the melting curve only ice and liquid coexist (F = 1). Adding the vapour as a third phase imposes one more condition, mu_vapour = mu_liquid, which pins the point. Miscounting the constraints as C(P - 1) = 1 instead of 2 gives this answer.
C. F = 2 is the single-phase answer: an area of the phase diagram. Each additional coexisting phase removes one freedom.
D. Freedoms are removed by coexistence, not added. With C = 1 the maximum is F = 2, for a single phase.
A strong sealed container is half full of liquid carbon dioxide with its vapour above it, and is slowly heated through the critical temperature, 304 K. What happens?
A. The meniscus fades and disappears -- the liquid’s density falls and the vapour’s rises until at T_c they are equal and one fluid fills the container; nothing boils and nothing is used up. B. The last of the liquid evaporates there, leaving only gas. C. The last of the vapour condenses, leaving only liquid. D. The container bursts, because the saturation pressure becomes infinite at T_c.
Check your answer
Correct answer: A — The meniscus fades and disappears -- the liquid’s density falls and the vapour’s rises until at T_c they are equal and one fluid fills the container; nothing boils and nothing is used up.
A. Right. Along the coexistence curve v_liq and v_gas approach each other (as sqrt(1 - T/T_c) in the model) and the latent heat falls to zero. At T_c the distinction between the two phases ends; the curve in the P-T plane simply stops. Cooling the container brings the meniscus back.
B. This is the misconception that the critical point is where the substance runs out of liquid. Nothing is exhausted: a half-full container stays at the critical density throughout, and the liquid does not boil away -- its density and the vapour’s simply become the same. The laboratory’s path around the critical point turns gas into liquid with no event at all along the way.
C. Neither phase wins. Both densities move toward the critical density, from opposite sides, and meet.
D. P_sat(T_c) = P_c is finite -- 7.4 MPa for carbon dioxide -- and above T_c the pressure simply follows the single-phase equation of state. The curve ends; it does not diverge.
For the van der Waals fluid the latent heat is L = k_B T ln((v_gas - b)/(v_liq - b)). At some temperature v_liq - b = 0.0383 L/mol and v_gas - b = 0.2244 L/mol. What is L in units of k_B T per molecule?
Check your answer
Correct answer: 1.77 (± 0.03)
L/(k_B T) = ln(0.2244/0.0383) = ln(5.86) = 1.77. The two phases differ in entropy only through their free volumes v - b. If you answered 0.77, you used log base 10; if 5.86, you forgot the logarithm.
In four or five sentences: why does “the two lobes have equal areas” follow from equal chemical potentials rather than being a drawing rule -- and if the flat line is the equilibrium, how can a superheated liquid exist at all?
Check your answer
Two phases that exchange particles are in equilibrium only at equal mu (module 13). At fixed T, Gibbs-Duhem gives d mu = v dP, so integrating along the model isotherm from the liquid state to the gas state, mu_gas - mu_liq = integral of v dP = P_sat (v_gas - v_liq) - integral of P dv by parts. Setting it to zero is exactly the statement that the chord cuts the loop into two lobes of equal area: the areas are a consequence, and the laboratory checks that bisecting the area difference and bisecting mu_liq - mu_gas give the same pressure. A superheated liquid sits on the liquid branch continued below P_sat, between the binodal and the spinodal: its slope (dP/dv)_T is still negative, so it is stable against small fluctuations -- the stability criterion is satisfied -- but its mu is higher than the vapour’s at the same T and P, so it is only metastable. Reaching the vapour needs a bubble, which costs surface energy the model ignores, so the liquid can persist until something nucleates one. A strong answer separates “the state exists” (the model’s claim) from “how long it lasts” (nucleation kinetics, outside the model).
Exam-style problems for this module — the ones worth doing with a pen — are collected in the problem set.
Explain it in your own words
Answer in a few sentences each.
A textbook says the flat line is drawn “so that the two areas are equal”. Explain why, in this module, that is a theorem rather than a drawing rule, and say exactly where the chemical potential enters.
Why can boiling water not get hotter than its boiling point while the pressure on it holds, however hard it is heated? Where does the heat go?
If the flat line is “the” equilibrium, how can a superheated liquid exist at all? What is the difference between the binodal and the spinodal, and which of the two does a superheated liquid live between?
What dies at the critical point? Answer in one paragraph without a formula.
Advanced: corresponding states for the coexistence curve
Module 02 showed that every van der Waals substance obeys the same equation once pressure, volume and temperature are measured in units of its own critical point: . Every step of this module was carried out on that equation — the construction, the lever rule, the latent heat — so every result is universal in reduced variables too: there is one van der Waals coexistence curve , one binodal dome, one function of , and the constants and do nothing but scale the axes. The laboratory computes the curve for carbon dioxide, nitrogen and water and finds them identical to one part in 1010.
Real substances are another matter. At the model gives ; measured carbon dioxide gives 0.314 and water 0.277. At the three are 0.812, 0.703 and 0.675. Two things are visible in those numbers. The model is quantitatively wrong by a margin that grows as falls — the mean-field attraction fitted at the critical point is too weak everywhere below it. And the two real substances, chemically nothing alike, are much closer to each other than either is to the model: a real law of corresponding states, Guggenheim’s, holds for many simple fluids to a few percent, with a universal boiling curve that is not the van der Waals one. Its origin is the same as the universality of the critical exponents in module 15 — the details of the molecule matter less than the fact that there is a critical point — and it is one more hint that the right theory of the critical region is not a mean field.