Thermal radiation and the heat capacity of solids
The puzzle: two catastrophes, one assumption
Set a kitchen oven to and look inside. It is dark. Its walls radiate, and you can feel it on your face, but nothing is visible: the radiation is infrared, peaking near .
Now apply the physics of modules 04 to 12, honestly. The inside of the oven is a box full of electromagnetic waves. Each standing wave that fits in the box is an oscillator, and equipartition hands every oscillator . There is no shortest wave that fits, so there is no last oscillator: the number of modes per unit frequency grows as the square of the frequency, and the energy grows with it. At the classical theory puts more energy into the visible band alone than the whole oven actually holds — by a factor of nineteen thousand — and more still into the ultraviolet, without limit. Every warm oven should be an ultraviolet lamp of infinite power.
The oven’s steel walls have a second problem. A solid of atoms is oscillators, one per direction of vibration per atom. Each, again, holds , so the heat capacity is — the Dulong–Petit value, about — at every temperature. Measure it. Silver at room temperature is close. Silver at has a heat capacity nearly nineteen hundred times smaller. Diamond is a quarter of the Dulong–Petit value at room temperature.
Module 12 already met the answer for a single oscillator, and called it freeze-out. This module takes the same idea to every mode of the electromagnetic field and every mode of a crystal, and finds that it rescues both. Along the way it meets a smaller puzzle that catches nearly everyone: the question “at what wavelength does the Sun shine brightest?” has two correct answers, and which one you get depends on how you draw the graph.
Predict before you calculate
Commit to an answer for each of these before reading on. Write them down.
An oven is heated from to . Does the total power its walls radiate grow by a factor of 2, 4, 8 or 16?
Plotted per unit wavelength, the Sun’s spectrum peaks near . Plotted per unit frequency, does it peak at the frequency of light, ?
A diamond is cooled from to . Does its heat capacity drop by a factor of about 10, or by several orders of magnitude? Sketch .
The temperature of a cavity is doubled. Does the number of photons inside it double?
Explore the model
The laboratory has two explorers. The first draws the blackbody spectrum at a temperature you choose, per unit frequency and per unit wavelength side by side, with the classical prediction on demand, and marks where each curve peaks — and where each peak lands when carried over to the other graph. The second draws the heat capacity of the Einstein and Debye models against measured data for silver from to , with a slider for each model’s one parameter. Then the laboratory runs the experiments this module is built on: the quantum formula rebuilt from module 12’s sum, the total energy integrated numerically, the two peaks located by brute force, both models fitted to silver, and a fit of the cosmic microwave background.
The blackbody spectrum as the temperature climbs from to , pausing at the Sun’s . Left: energy per unit volume per unit frequency, , against frequency (blue). Right: energy per unit volume per unit wavelength, , against wavelength (red). The tinted band is visible light, 380 to . Each curve is drawn scaled to the height of its own peak, so that shapes and positions can be compared; the energy under the real curves grows fiftyfold over the sweep, as . Each panel’s solid line marks its own peak; the dashed line marks the other panel’s peak, carried over by . The dashed line never lands on the solid one: at every temperature the frequency curve peaks at a photon whose wavelength is 1.76 times the wavelength at which the wavelength curve peaks — the ratio printed above the panels. Both curves describe the same radiation, and the energy under them is the same.
Run the laboratory now, then come back. Four things are worth doing before you read on:
Set the temperature to , the Sun’s surface. Read off both peaks. Is the frequency peak’s photon visible?
Switch on the classical curve at , then at . Where does it agree with the quantum one, and where does it stop agreeing?
Double the temperature twice, and watch the area under the curves.
In the solids explorer, find the Einstein temperature that best matches silver near . Then switch to the log–log view and look at .
Derive the result
System and boundary. Two systems with one structure. A cavity of volume whose walls are held at temperature , containing electromagnetic radiation; and a crystal of atoms at temperature . Both are collections of independent harmonic modes, each in contact with a heat bath — the walls for the radiation, the rest of the crystal for each of its vibrations.
Independent variables. The temperature and the volume . Everything else — the energy, the spectrum, the pressure of the radiation, the number of photons — is a function of these two.
Sign convention. The course convention, , holds. It is exercised once, in step 5: compressing radiation takes work, when , because radiation has a pressure.
Units. SI throughout, with , and written explicitly; . A mode of frequency (in hertz) has angular frequency and quantum . Spectra are energies per unit volume per unit frequency, in , or per unit wavelength, in .
Route. Seven steps. Find the mean energy of one quantized mode; count the modes of a cavity; multiply, to get Planck’s law, and change the spectral variable; integrate, to get the Stefan–Boltzmann law; read off the thermodynamics of the photon gas; and then apply the same mode-by-mode reasoning to a solid, first with one frequency (Einstein) and then with a spectrum of them (Debye).
Step 1: one mode, one formula
The single change that rescues both catastrophes is an assumption about energy, not about statistics. It is taken here as an input.
Module 12 summed the Boltzmann factors of exactly this ladder. Measured from the ground state, the oscillator’s partition function is a geometric series,
and its mean energy is minus the derivative of with respect to .
Both limits matter.
A cheap quantum, . Expanding gives . This is equipartition: the classical answer is the limit of the quantum one when the quantum is small compared with the thermal energy.
A dear quantum, . The -1 is negligible and : exponentially small. The bath almost never supplies a whole quantum at once, and the mode sits in its ground state.
That second limit is the cure, and it is worth saying what it is not. A frozen-out mode is not still. In its ground state an oscillator keeps its zero-point motion; what it cannot do is accept energy in amounts smaller than . Freeze-out is unaffordability, not stillness.
Step 2: counting the modes of a cavity
Take the cavity to be a cube of side with perfectly reflecting walls. A standing wave must fit a whole number of half-wavelengths along each edge, so its wave vector is
and its frequency is . Each allowed carries two independent polarizations. Counting modes is counting the points of an integer lattice. The modes with frequency below are the lattice points inside a sphere of radius , restricted to the octant where all three integers are positive. When the radius is large there is one lattice point per unit volume, and the count is the octant’s volume:
The approximation in “count the volume instead of the points” is checkable, and the laboratory checks it: the count misses the lattice points on the octant’s three flat faces — waves with one index equal to zero, which exist but carry only one polarization — and the error is a surface-to-volume ratio, of relative size about . For a cavity at room temperature the important modes have of order a thousand.
Now hand every mode the classical . The energy per unit volume per unit frequency is
the Rayleigh–Jeans law. It describes real cavities well at low frequency. But it grows as without limit, and the total energy is its integral over all frequencies.
The classical spectrum (red, dashed) against the quantum one (blue) as the temperature rises from to , with the visible band tinted; both are scaled so that the quantum curve’s peak has the same height in every frame. The two agree at low frequency, where a quantum is cheap and every mode holds close to . Above the peak the quantum curve turns over, because modes whose quantum exceeds a few are frozen out; the classical curve does not, and the area under it is infinite. The frequency where they part company moves up in proportion to the temperature.
Step 3: Planck’s law, in two variables
The quantum version of the same product, modes per unit volume per unit frequency times mean energy per mode, is the answer.
At low frequency it becomes Rayleigh–Jeans, which is where the classical theory was right. At high frequency it falls as , which is where the classical theory was wrong. Planck found the formula in 1900 by fitting measured spectra, and then found the quantization that produces it; it is the oldest result of quantum physics.
Spectra are also drawn against wavelength. The step from one to the other looks like substitution, and it is not, because is not a function of the radiation alone. It is a density: the energy in a narrow band is , and only that product is physical.
Applied to Planck’s law,
Now find both peaks. Per unit frequency, write ; then , and setting its derivative to zero gives
so
Per unit wavelength, write ; then — two more powers, from the Jacobian — and the same calculation gives
so
For the Sun, at : , green light. But , the frequency of light — in the infrared, invisible. Both statements are correct. Neither is “where the Sun’s light really peaks”, because there is no such place: the peak belongs to the graph, not to the light. The Jacobian is largest at short wavelength, where a nanometre spans many terahertz, so per unit wavelength the blue end of the spectrum is weighted up and the peak shifts toward it. A third choice — per unit , equal ratios of frequency, which is also per unit — peaks between the other two, at , for the Sun.
Step 4: the Stefan–Boltzmann law
The total energy density does not depend on the choice of variable. Integrating Planck’s law over frequency with ,
The remaining integral is a pure number. It equals (it is , where is the Riemann zeta function); this module quotes the value and the laboratory checks it numerically.
The factor is kinetic theory’s count of what crosses a hole: half the photons next to it are moving toward the wall, and their mean velocity across it is , so the flux is a quarter of the density times the speed. Stefan found the fourth power in 1879 by reading other people’s measurements, as an empirical law; Boltzmann derived it from thermodynamics in 1884, but could not get , which needs . The fourth power means that temperature is a powerful lever: doubling it multiplies the radiated power by sixteen.
Instruments pointed at a source measure the spectral radiance, the power per unit area, per unit frequency, per unit solid angle, , in . It has the same shape as .
The number of photons follows the same way, with one power of fewer:
with : about photons per cubic metre, in kelvin. The photon number grows as . Photons are not conserved; heating a cavity creates them.
Step 5: the photon gas
Radiation in a cavity is a gas — of photons — and has a pressure, an entropy and a chemical potential. Each takes a line.
Pressure. Module 04 found the pressure of a gas as a momentum flux: for an isotropic gas, , a third of the density of the product of momentum and speed. For a nonrelativistic particle , twice the kinetic energy, and . A photon has and momentum , so , and
It is small at ordinary temperatures — at — and it does work: compressing the cavity takes , positive as the volume shrinks. That is radiation pressure, the pressure that holds up the most massive stars.
Entropy. At fixed volume no work is done, so (module 09). The heat capacity is , and integrating up from absolute zero,
Under a slow adiabatic expansion stays fixed, so is constant and : radiation cools in inverse proportion to the size of its container. That is why the radiation left over from the early universe is now at .
Chemical potential.
Step 6: the Einstein solid, measured at last
Module 01 let two Einstein solids exchange quanta; module 09 built the Einstein solid’s entropy; module 12 found its temperature from the oscillator partition function. The model was always the same: atoms, each vibrating in three directions, as independent oscillators sharing one frequency. Here it finally makes a prediction that a calorimeter can test.
With , step 1 gives each oscillator above its ground state, so
and differentiating with respect to :
This is module 12’s oscillator heat capacity multiplied by ; the laboratory checks that the two are the same function to the last digit. Its limits:
Hot, . . Per mole, .
Cold, . : exponentially small, every oscillator frozen out.
The high-temperature expansion also pays off a debt. Module 01 used a constant heat capacity, one per oscillator, and warned that it was an approximation. The error is now known: a fraction when is large, at , at . The constant- picture is safe above about and fails, by exponentially much, well below it.
And the low-temperature limit fails a different test. Measured heat capacities of insulating crystals do vanish at low temperature, but as , not exponentially. An exponential falls far faster than any power: the Einstein model predicts far too little heat capacity when cold. The culprit is its one frequency. A real crystal also vibrates slowly — sound waves of long wavelength — and a mode of low enough frequency is never frozen out.
Step 7: Debye’s repair
The vibrations of a crystal are waves. At long wavelengths they are sound, travelling at a speed , with three polarizations — two transverse, one longitudinal — instead of light’s two. Their quanta are called phonons, and like photons their number is not conserved. Debye’s model counts them exactly as step 2 counted photons, with in place of and three polarizations in place of two. In angular frequency,
A crystal of atoms has only modes — a wave shorter than twice the atomic spacing is no new motion — so Debye cuts the spectrum off at the frequency where the count reaches :
Summing step 1 over this spectrum and differentiating, with :
Hot, . The integrand is over a short range, the integral is , and : Dulong–Petit again, with a correction .
Cold, . The upper limit can be taken to infinity, where the integral is .
The has a direct explanation. At low only modes with are active; there are about of them, as for photons; each holds about . So and — the Stefan–Boltzmann law of sound.
The Debye model (blue) and the Einstein model (red) against silver’s measured heat capacity (black, the electrons’ removed), divided by . The Debye temperature sweeps from 120 to and settles at ; the Einstein temperature is tied to it by , so that the two models agree when hot. On linear axes the two curves differ only near the foot of the rise, and either looks like a fair description. Then the axes switch to logarithmic. Now the measurements below about fall on a straight line of slope 3 down to , Debye follows them, and Einstein falls away exponentially below about — about 550 times too low at , and off the bottom of the plot soon after. A linear plot hides the difference that decides between the models.
Two corrections stand between these models and a table of measurements.
Verify computationally
Every number below comes from thermolab.radiation. Nothing in this module is random; the
numbers are deterministic. The uncertainties quoted for the silver fits come from the scatter
of the data about the model curve; the one for the microwave background comes from the
published measurement errors. The laboratory repeats each experiment.
1. The occupation, rebuilt from module 12’s sum. For a mode with quantum , the closed form and an explicit Boltzmann sum over 4000 levels, using module 12’s code, agree to 10-12 at 30, 300 and . Step 1’s formula is module 12’s partition function, nothing added.
2. Counting standing waves one by one. Enumerating the integer triples in a cube, mode by mode, and comparing with the smooth count : the explicit count falls short by at , at 80 and at 320. The shortfall halves each time the radius doubles — the missing face modes, about — and the smooth formula is its limit.
3. The Stefan–Boltzmann law by quadrature.
4. One energy, two densities, two peaks. Integrating over wavelength — a different variable, on a logarithmic grid, sharing nothing with item 3’s grid — reproduces to 10-16, and so agrees with item 3’s frequency integral to that integral’s own error, , at 2.725, 300 and . A brute-force search over points finds the maximum of at and of at ; their product is at every temperature. The energy agrees and the peaks do not, which is exactly what a density does.
5. Hotter is not brighter. Doubling the temperature from 300 to multiplies the integrated energy by 16.000. At fixed frequency, though, the ratio of the two spectra is not one number: it is 2 at the low-frequency end, where both curves follow Rayleigh–Jeans, 120 at , and it grows without limit in the far tail, where the hotter body has photons the colder one cannot afford. No vertical rescaling turns one curve into the other. The peak moves, from 9.66 to .
6. The two solids, against each other. Both heat capacities reach at high temperature, Einstein as and Debye as , each confirmed to fourth order. In the cold, the log–log slope of the Debye curve below is 3 to within 10-15, and the curve equals the law there to 10-11. Over the window to the Einstein curve’s slope is about 19. The models are told apart by a slope.
7. Against reality: silver. The data are the recommended heat capacities of silver from 1 to tabulated by the US National Institute of Standards and Technology (Smith and Fickett, 1995), converted to a mole.
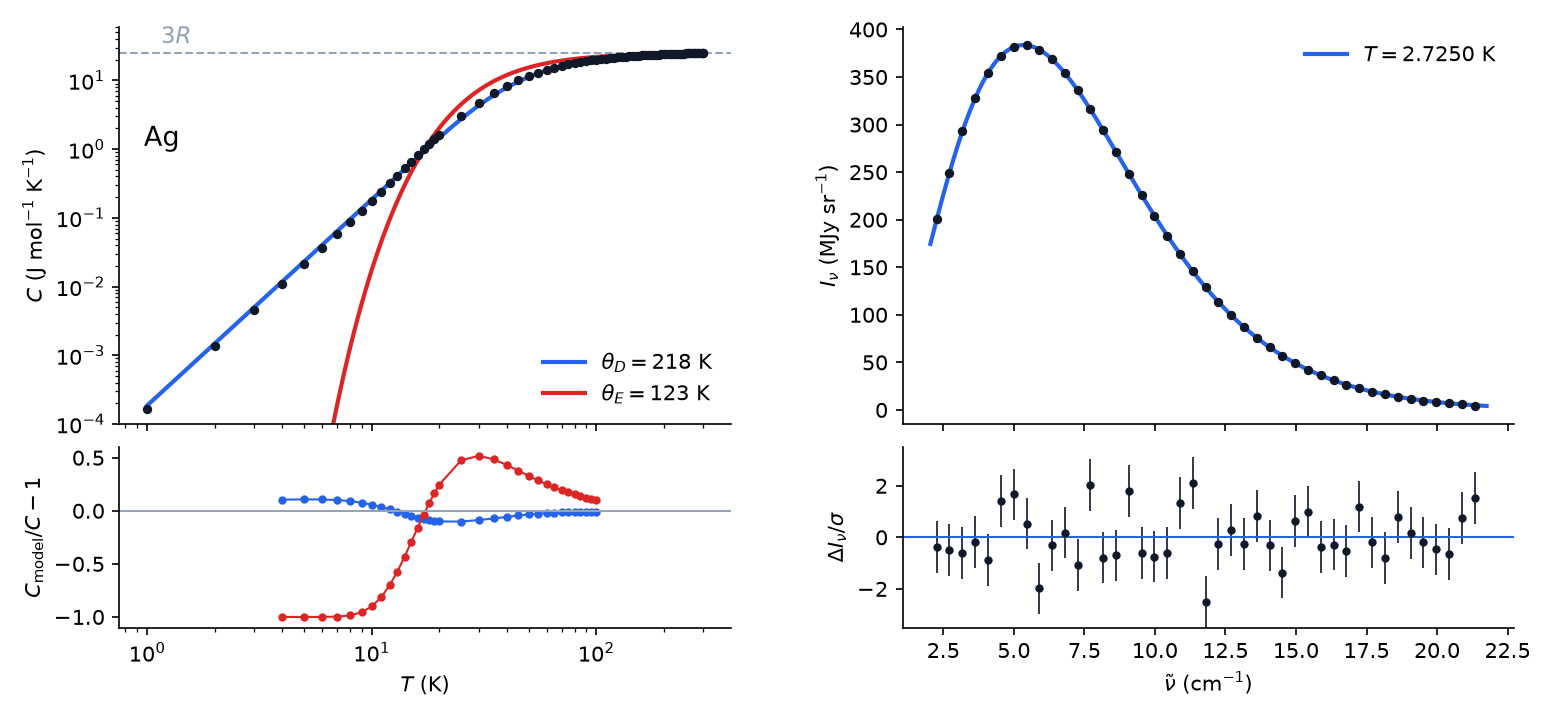
Left: silver’s molar heat capacity (black points), with the electrons’ subtracted, against the best Debye curve (blue, ) and the best Einstein curve (red, ), both fitted between 4 and ; the dashed line is . The strip beneath shows each model’s fractional residual. Right: the cosmic microwave background measured by COBE’s FIRAS instrument (black points; their error bars, smaller than the points, are not drawn) and the fitted Planck curve (blue), with the residuals beneath, magnified, in units of each point’s uncertainty.
The low-temperature line. Below , plotted against is a straight line, : the electrons’ term plus Debye’s . Its intercept is , within of the paper’s 0.641, and its slope gives, through , a Debye temperature against the paper’s .
The slope. With that subtracted, the log–log slope of the data between 1 and is 3.00: Debye’s . Without the subtraction it is 1.87 between 1 and , because the electrons’ share is large there — of the heat capacity at , half at . That is the model specification’s failure mode for metals, visible in real numbers.
The fits. Fitting each model’s one parameter to the lattice heat capacity between 4 and by least squares on fractional residuals: Debye gives with a root-mean-square residual of and none worse than . Einstein gives with a root-mean-square residual of ; at it predicts essentially nothing, and at a tenth of what is measured. The data reject Einstein at low temperature and accept Debye — to within , not to within the data’s precision.
The drift. Solving the Debye formula for the that reproduces each measured point gives below , at and at . A one-parameter model fits the whole curve only by letting its parameter wander by : this is the real phonon spectrum showing through the caricature, and the reason a fitted should be quoted with the temperature range it came from.
8. Against reality: the cosmic microwave background. COBE’s FIRAS instrument measured the radiation filling the universe at 43 frequencies between 68 and . A one-parameter fit of Planck’s law, in radiance, gives , with for 42 degrees of freedom: a Planck curve is the right shape, within the measurement’s precision. All but the two noisiest points sit within of the curve, 1.5 parts in 104 of its peak. Two cautions belong with the number. The quoted uncertainty is statistical only, and the treats the published errors as independent, which they are not quite; FIRAS’s calibration limits the absolute temperature to . And the archive builds its spectrum column as a Planck curve plus the measured residuals, so a fit recovers the temperature the residuals were taken against: what this data set tests is the shape, and the shape is Planck’s law. FIRAS plots its spectrum per unit frequency, where it peaks at , a wavelength of ; per unit wavelength the same radiation peaks at .
9. Diamond and lead, at room temperature. Measured at , diamond’s heat capacity is (DeSorbo, 1953; Victor, 1962) — of Dulong–Petit — and lead’s is 26.84 (NIST-JANAF), above it, the excess being and anharmonicity. Diamond’s light atoms and stiff bonds give it a Debye temperature near from low-temperature data; lead’s is about . With those values the Debye model puts diamond at of at room temperature, too low: the that reproduces the room-temperature value is . Diamond’s Debye temperature drifts with too.
The falsifying experiments. Each misconception this module confronts has a measurement above that it cannot survive. “The peak of the spectrum is a property of the radiation”: item 4, where the two peaks differ by a factor 0.568 at every temperature while the energies agree to , and item 8, where the cosmic background peaks at 1.87 or depending on the axis. “Hotter bodies are brighter versions of the same spectrum”: item 5, where doubling multiplies the energy by sixteen while the ratio of the two spectra runs from 2 upward without limit. “A cold solid’s atoms stop moving, so it stores no heat”: items 6 and 7 — the heat capacity vanishes as the quanta become unaffordable, at a rate set by how many cheap modes the crystal has, while the zero-point motion that step 1 set aside persists at absolute zero.
Transfer the idea
One idea — energy in quanta, so expensive modes freeze out — did two jobs in this module. It travels much further.
Back to module 12. Step 1 is module 12’s oscillator: the occupation is divided by the quantum. Module 12 called the cold limit freeze-out and predicted that it would rescue the solid; here it rescues radiation too.
Back to modules 01 and 09. The Einstein solid’s spiral closes. Module 01 exchanged its quanta and assumed a constant heat capacity; module 09 built its entropy; module 12 read its temperature from . Here the same model predicts a curve that a calorimeter measures, and its failure at low temperature is what sends us to Debye. Module 01’s constant- approximation is now quantified: safe above , wrong by at .
Back to modules 04 and 06. Equipartition is the high-temperature limit of step 1. The freeze-out caveat modules 04 and 06 attached to it — why air’s vibrations do not count at room temperature — is the same exponential. Module 04’s momentum-flux argument gave for photons with one change, .
Back to module 10. is why a table of can exceed Dulong–Petit at room temperature, as lead’s does.
Forward to module 17. The occupation is the Bose–Einstein distribution with . Module 17 derives the general case, for particles whose number is conserved, and its verification recomputes this module’s Planck curve from that general formula. The photon gas returns there as the example of a gas that cannot condense.
Module 18 owes this module nothing; transport of heat by radiation and by phonons is not treated there.
Pyrometry. A pyrometer measures the temperature of a furnace or a star from its colour — from the shape of its spectrum, not its brightness, which also depends on distance and emissivity. Every pyrometer has to say which spectral variable its “peak” uses.
Thermal imaging. A human body at radiates most strongly per unit wavelength near ; thermal cameras are built for the band from 8 to for that reason.
The incandescent lamp. A tungsten filament at puts of its radiation into the visible band, 380 to ; the rest is infrared, which is why such lamps are inefficient and were phased out. Sunlight, at , puts there. Eyes evolved under the Sun.
The early universe. The cosmic microwave background is the most perfect blackbody ever measured. Its spectrum shows that the universe was once hot, dense and in equilibrium; its temperature, , falls as the universe expands, as step 5 requires of radiation expanding adiabatically.
Looking ahead:
Module 17 takes the occupation of step 1 to particles that cannot be created or destroyed — atoms, electrons — and finds Bose–Einstein condensation and the Fermi sea.
Module 18 turns from equilibrium to how it is reached: fluctuations, and the transport they drive.
Worked examples
Try each one before opening its solution.
Worked example 1 — the Sun’s two peaks. The Sun’s surface radiates as a blackbody at . Find the wavelength at which peaks, and the frequency at which peaks. What wavelength of light has that frequency?
Solution
. , the frequency of light of wavelength , in the near infrared. The ratio , as it must be at any temperature.
Worked example 2 — an oven, doubled. An oven’s walls are raised from 300 to . By what factor does the power they radiate grow, and where does the spectrum per unit wavelength peak before and after?
Solution
Power scales as : . The peak moves from to . A spectrum that only got brighter would have kept its peak and grown by a factor of 2, the ratio of temperatures — which is what it does at the far infrared end, and nowhere else.
Worked example 3 — the photons in a room. How many photons are there in a cubic centimetre of a room at , and in a cubic centimetre of intergalactic space, filled with the background? What is a background photon’s mean energy?
Solution
gives at , per cubic centimetre, and — 411 per cubic centimetre — at . The mean energy per photon is , for the background.
Worked example 4 — module 01’s constant heat capacity. Module 01 treated an Einstein solid as having per oscillator. What fraction of that does the Einstein model give at , at and at ?
Solution
. At : . At : 0.921. At : 0.9967, against the series . Module 01’s approximation is good to at and degrades quickly below it.
Worked example 5 — silver at 4 K. From and , predict silver’s molar heat capacity at , and compare with the tabulated .
Solution
Lattice: . Electrons: . Total 0.0133, against 0.0134 measured. Without the electrons the prediction would be low; at this temperature they are a fifth of the answer.
Worked example 6 — the Sun’s power. The Sun’s radius is and its surface temperature . Estimate its luminosity.
Solution
. The value adopted by the International Astronomical Union is — not a coincidence: the Sun’s “effective temperature” is defined as the blackbody temperature that radiates its measured power.
Check your understanding
A mode of the electromagnetic field has a quantum h nu = 3 k_B T. What is its mean energy above the ground state, in units of k_B T?
A. 3/(e^3 - 1) = 0.157 -- the mode is mostly in its ground state, because a whole quantum costs three times the typical thermal energy. B. 1 -- every mode carries k_B T regardless of its frequency. C. 3 -- the mode holds exactly one quantum. D. 0 -- a quantum larger than k_B T can never be excited.
Check your answer
Correct answer: A — 3/(e^3 - 1) = 0.157 -- the mode is mostly in its ground state, because a whole quantum costs three times the typical thermal energy.
A. Right. = h nu/(e^(h nu/(k_B T)) - 1) = 3 k_B T/(e^3 - 1) = 0.157 k_B T. The mode is not frozen solid -- about one time in twenty it holds a quantum -- but it holds far less than the classical k_B T, and modes of higher frequency hold exponentially less.
B. That is equipartition, the classical assumption this module overturns. It is the limit of the quantum result when h nu << k_B T; at h nu = 3 k_B T it overestimates the energy six-fold, and applied to every mode it gives the ultraviolet catastrophe.
C. The number of quanta is not fixed; it fluctuates, and its mean is = 1/(e^3 - 1) = 0.052. A mode holds one quantum only about 5% of the time at this temperature, and zero quanta most of the time.
D. Large quanta are exponentially suppressed, not forbidden. The Boltzmann factor for one quantum is e^-3 = 0.05, small but not zero; freeze-out is a smooth exponential, not a hard cut-off.
Classical physics predicts that the radiation in a warm cavity holds infinite energy. What, precisely, diverges?
A. The number of modes per unit frequency grows as nu^2 without limit, and equipartition gives each one k_B T, so the integral of 8 pi nu^2 k_B T / c^3 over all frequencies is infinite. B. Photons travel at the speed of light, so their energy is infinite. C. The walls absorb and re-emit without limit, so energy accumulates forever. D. The energy of each mode grows with its frequency, so the highest modes carry infinite energy.
Check your answer
Correct answer: A — The number of modes per unit frequency grows as nu^2 without limit, and equipartition gives each one k_B T, so the integral of 8 pi nu^2 k_B T / c^3 over all frequencies is infinite.
A. Right. Mode counting in a cavity gives g(nu) = 8 pi V nu^2 / c^3: there is no shortest standing wave, so no last mode. Each mode is an oscillator holding k_B T classically. The quantum fix keeps the mode count and changes the energy per mode, which falls exponentially once h nu exceeds a few k_B T.
B. A photon’s energy is h nu, finite at every frequency. The divergence is a counting problem: infinitely many modes, each given the same finite classical energy.
C. In equilibrium the walls emit exactly as much as they absorb; nothing accumulates. The classical catastrophe is a statement about the equilibrium state itself, not about a runaway process.
D. Classically each mode carries the same k_B T, independent of its frequency. It is the number of modes, not the energy of each, that grows without bound.
Plotted per unit wavelength, the Sun’s spectrum (a blackbody near 5772 K) peaks at about 500 nm. Plotted per unit frequency, where does it peak?
A. At about 340 THz, the frequency of 880 nm light -- a different photon, because u_nu and u_lambda are densities related by the Jacobian c / lambda^2, which moves the maximum. B. At c / 500 nm = 600 THz -- same spectrum, same peak. C. At 1200 THz, because frequency is inversely proportional to wavelength, so a peak at short wavelength is a peak at high frequency. D. There is no peak per unit frequency; u_nu grows without bound.
Check your answer
Correct answer: A — At about 340 THz, the frequency of 880 nm light -- a different photon, because u_nu and u_lambda are densities related by the Jacobian c / lambda^2, which moves the maximum.
A. Right. nu_max = 2.821 k_B T/h = 339 THz, and c/nu_max = 883 nm. The two peaks differ by nu_max lambda_max / c = 0.568 at every temperature. The energy in any band is the same in both descriptions; the location of “the peak” is a property of the graph, not of the light.
B. This is the misconception that the peak is a property of the radiation alone. u_nu and u_lambda are not the same function relabelled: u_lambda = u_nu c / lambda^2, and the factor c / lambda^2 changes from point to point, so the maxima fall at different photons. The explorer shows both markers; the mapped one never lands on the other.
C. Inversion is right for converting one photon’s wavelength into its frequency (500 nm is 600 THz, not 1200), but the question is where the density per unit frequency is largest, and that requires the Jacobian, not just the inversion.
D. That is the classical Rayleigh-Jeans curve. Planck’s u_nu has a maximum at x = h nu / (k_B T) = 2.821 and falls exponentially beyond it.
Sirius A has a surface temperature of about 9940 K. Treating it as a blackbody, at what wavelength, in nanometres, does its spectrum per unit wavelength peak? (Use lambda_max T = 2.898e-3 m K.)
Check your answer
Correct answer: 292 (± 2)
lambda_max = 2.898e-3 / 9940 = 2.92e-7 m = 292 nm, in the ultraviolet. Per unit frequency the peak is nu_max = 2.821 k_B T/h = 5.84e14 Hz, the frequency of 513 nm light; the ratio nu_max lambda_max / c = 0.568, as at every temperature. If you answered 513, you computed the frequency peak and converted it to a wavelength.
The walls of an oven are heated from 300 K to 600 K. By what factor does the total power they radiate increase?
Check your answer
Correct answer: 16 (± 0.1)
Power scales as sigma T^4, so the factor is 2^4 = 16. If you answered 2, you assumed that a hotter body radiates the same spectrum made brighter in proportion to its temperature: that is true only at the far low-frequency end. The spectrum also gains photons at frequencies the colder body could not afford, and its peak moves from 9.66 to 4.83 micrometres. If you answered 8, you counted photons (T^3) rather than energy.
Why is the chemical potential of the photon gas in a cavity zero?
A. The walls absorb and emit photons freely, so the photon number is not conserved; it adjusts to minimize the free energy at fixed T and V, where (dF/dN)_{T,V} = mu = 0. B. Photon number is conserved, so mu is fixed by it and happens to be zero. C. Photons are massless, and a chemical potential is an energy of mass. D. Photons do not interact with each other, and mu measures interactions.
Check your answer
Correct answer: A — The walls absorb and emit photons freely, so the photon number is not conserved; it adjusts to minimize the free energy at fixed T and V, where (dF/dN)_{T,V} = mu = 0.
A. Right. A conserved number is a constraint, and its chemical potential is the price of adding one more; an unconserved number is a variable that relaxes to the minimum of F. A checkable consequence: the photon number is not fixed but grows as T^3 when the cavity is heated, and U = TS - PV holds exactly.
B. Photon number is not conserved in a cavity with walls: heating the cavity creates photons (n grows as T^3), cooling destroys them. If it were conserved, mu would be whatever value fixed the number -- generally not zero -- as for the atoms of module 17.
C. The chemical potential is the free-energy cost of adding a particle at fixed T and V, not a rest energy. Masslessness alone does not set mu = 0; non-conservation does. Light in a box with perfect mirrors and nothing to absorb it would conserve photons.
D. A non-interacting gas of conserved particles, such as module 13’s ideal gas, has a perfectly good nonzero mu = k_B T ln(n / n_Q). The reason is non-conservation, not the absence of interactions.
In the Einstein model, what is the heat capacity at T = theta_E / 2, in units of the Dulong-Petit value 3 N k_B?
Check your answer
Correct answer: 0.724 (± 0.005)
With x = theta_E / T = 2, C/(3 N k_B) = x^2 e^x/(e^x - 1)^2 = 4 e^2/(e^2 - 1)^2 = 0.724. At T = 5 theta_E (x = 0.2) it is 0.9967, matching the series 1 - x^2/12: Dulong-Petit is the high-temperature limit. If you answered 0.541, you used x^2 e^-x, the low-temperature approximation, outside its range.
The heat capacity of an insulating crystal, measured below 10 K, falls with log-log slope 3. Which model survives, and why does C fall at all?
A. Debye -- the crystal has sound modes of arbitrarily low frequency, whose quanta remain affordable; as T falls, fewer modes (about V (k_B T / hbar c_s)^3 of them) can accept energy, so C falls as T^3. B. Einstein -- both models vanish at T = 0, so either fits. C. Neither -- the atoms are frozen still at low temperature, so no energy can be stored and C drops to zero at once. D. Einstein, provided theta_E is chosen small enough.
Check your answer
Correct answer: A — Debye -- the crystal has sound modes of arbitrarily low frequency, whose quanta remain affordable; as T falls, fewer modes (about V (k_B T / hbar c_s)^3 of them) can accept energy, so C falls as T^3.
A. Right. Debye’s spectrum always contains modes with hbar omega < k_B T, and counting them gives T^3, as counting photons gives the T^3 of the photon number. C falls because quanta become unaffordable, mode by mode; the atoms keep their zero-point motion.
B. Both vanish, but Einstein’s C falls as x^2 e^-x, exponentially, far faster than any power: its log-log slope is not constant and is about 19 between theta/40 and theta/10. The slope distinguishes the models, and the data choose Debye.
C. This is the misconception that cold atoms stop moving. Each oscillator keeps its zero-point energy hbar omega/2 at T = 0, and the heat capacity falls smoothly, as T^3, not suddenly. C is small because the bath rarely supplies a whole quantum, not because motion has stopped.
D. A smaller theta_E delays the collapse but does not change its form: below about theta_E / 5 the Einstein curve still falls exponentially. No single frequency gives a power law.
The temperature of a closed cavity is doubled. By what factor does the number of photons inside it change?
Check your answer
Correct answer: 8 (± 0.05)
n = 16 pi zeta(3) (k_B T / h c)^3, so doubling T multiplies the photon number by 2^3 = 8. Photons are created by the walls, not conserved. The energy grows by 16 (T^4), so the mean energy per photon, 2.70 k_B T, doubles. If you answered 2, you treated photons like the molecules of a sealed gas, whose number heating cannot change.
In four or five sentences: name the one classical assumption behind both the ultraviolet catastrophe and the failure of Dulong-Petit at low temperature, explain how a single change rescues both, and explain why a crystal’s heat capacity falls toward zero although its atoms never stop moving.
Check your answer
Both predictions rest on equipartition: every mode -- every standing wave in a cavity, every vibration of a crystal -- holds k_B T on average, whatever its frequency. With infinitely many cavity modes this gives infinite energy; with 3N crystal modes it gives C = 3 N k_B at all temperatures. The single change is quantization: a mode of frequency nu holds energy only in quanta h nu, so its mean energy is h nu/(e^(h nu/(k_B T)) - 1), which is k_B T for cheap quanta and exponentially small for dear ones. High-frequency cavity modes and, when cold, the crystal’s modes cannot afford a quantum and drop out. The atoms keep their zero-point motion at T = 0; what vanishes is their ability to accept small amounts of energy, which is what a heat capacity measures. A strong answer adds that Debye’s low-frequency modes keep a few modes affordable, giving T^3 rather than an exponential.
Exam-style problems for this module — the ones worth doing with a pen — are collected in the problem set.
Explain it in your own words
Answer in a few sentences each.
Why is “the peak of the blackbody spectrum” not a well-posed quantity until a spectral variable is named? What is well-posed?
A solid’s heat capacity falls to zero at low temperature, yet its atoms never stop moving. Explain both halves of that sentence.
Name the one classical assumption behind both the ultraviolet catastrophe and the failure of Dulong–Petit at low temperature, and explain how a single change to it rescues both.
In one sentence: why do photons have zero chemical potential?
Advanced: a planet’s energy balance
The bare planet. The Earth intercepts sunlight with its cross-section, , and radiates from its whole surface, . The solar constant, the flux of sunlight at the Earth’s distance, is , and the planet reflects a fraction of it, its albedo. If the surface radiates as a blackbody at a single temperature , balancing what is absorbed against what is emitted,
That is . The measured mean surface temperature is about , .
One absorbing layer. Add an atmosphere idealized as a single layer that lets sunlight through and absorbs all thermal radiation. Wien’s law is what makes the idealization reasonable: sunlight peaks per unit wavelength near , a planet near , and gases such as water vapour and carbon dioxide absorb strongly in the second range and hardly in the first. The layer, at temperature , radiates both up and down. In equilibrium the top of the layer must emit to space what the planet absorbs, and the layer must emit as much as it receives from the surface:
so and the surface sits at : warmer, because it receives the layer’s downward radiation as well as the Sun’s. With such layers, .
The toy explains the mechanism: an absorbing layer does not trap heat by blocking it, but by re-emitting it at a temperature lower than the surface’s, so that the planet must warm until the top layer radiates enough. Adding absorbers raises the altitude from which the planet radiates to space; because the atmosphere is colder higher up, that altitude must warm.